Key takeaways
- Branch now shows the logic behind every attribution decision, including which method it used, which partner won credit and why, and what each network reported on its own platform.
- Sets let you group campaigns and creatives the way your team already thinks about them, like by creative concept or market, across every ad partner.
- Formulas let you build metrics beyond Branch’s built-in set, like IPM or cost per subscriber.
- Sticky notes keep instructions, targets, and context on the dashboard, right where your team looks.
If you’re in charge of mobile growth, you probably spend more time than you’d like moving between tools to answer a single question. By the time you figure it out, the window to act has usually closed.
We rebuilt the Branch platform to make it easier to find the data you need, and faster to act on it. What you’ll find is a smarter, more connected platform that links customer journeys across all of your channels and surfaces insights as they happen.
Below are four ways to get more out of the new Branch experience, each with a quick walkthrough you can try on day one.
1. See the logic behind every attribution decision
Privacy frameworks and the aggregate measurement many self-attributing networks (SANs) rely on have made attribution more complicated and harder to follow from the outside. Branch now opens up that logic. You can see which attribution method Branch used for each conversion, which partner won credit and why, and what each network reported on its own side.
What’s new
- Attribution method dimensions: New dimensions in Branch’s attribution taxonomy show the method type behind each conversion: Branch Deterministic, Branch Modeled, or Partner Deterministic.
- Network performance data: Branch pulls in the install, open, and reinstall counts that major networks like Meta, TikTok, Apple, Snap, and Google report in their own systems, so you can compare them side by side with Branch’s numbers.
- Arbitration data: For SANs, Branch shows how many conversions each partner claimed, which partner won the attribution decision, and why a claim did or didn’t win credit.
Try it
Say you want to understand TikTok’s numbers. In Ads Analytics > Activity, filter to TikTok and try this:
- Add Arbitration Installs to see every install claim TikTok sent to Branch during your reporting window.
- Group by Arbitration Win-Loss Reason to see how many claims TikTok won and why it lost the rest. Then add Arbitration Winner to see which partner or channel won instead.
- Break down installs by attribution method type. Partner Deterministic installs are the claims TikTok won, so they should match what you saw in step 2. Branch Deterministic and Branch Modeled installs are additional conversions Branch matched to TikTok using its own signals, such as browser and deep linking context.
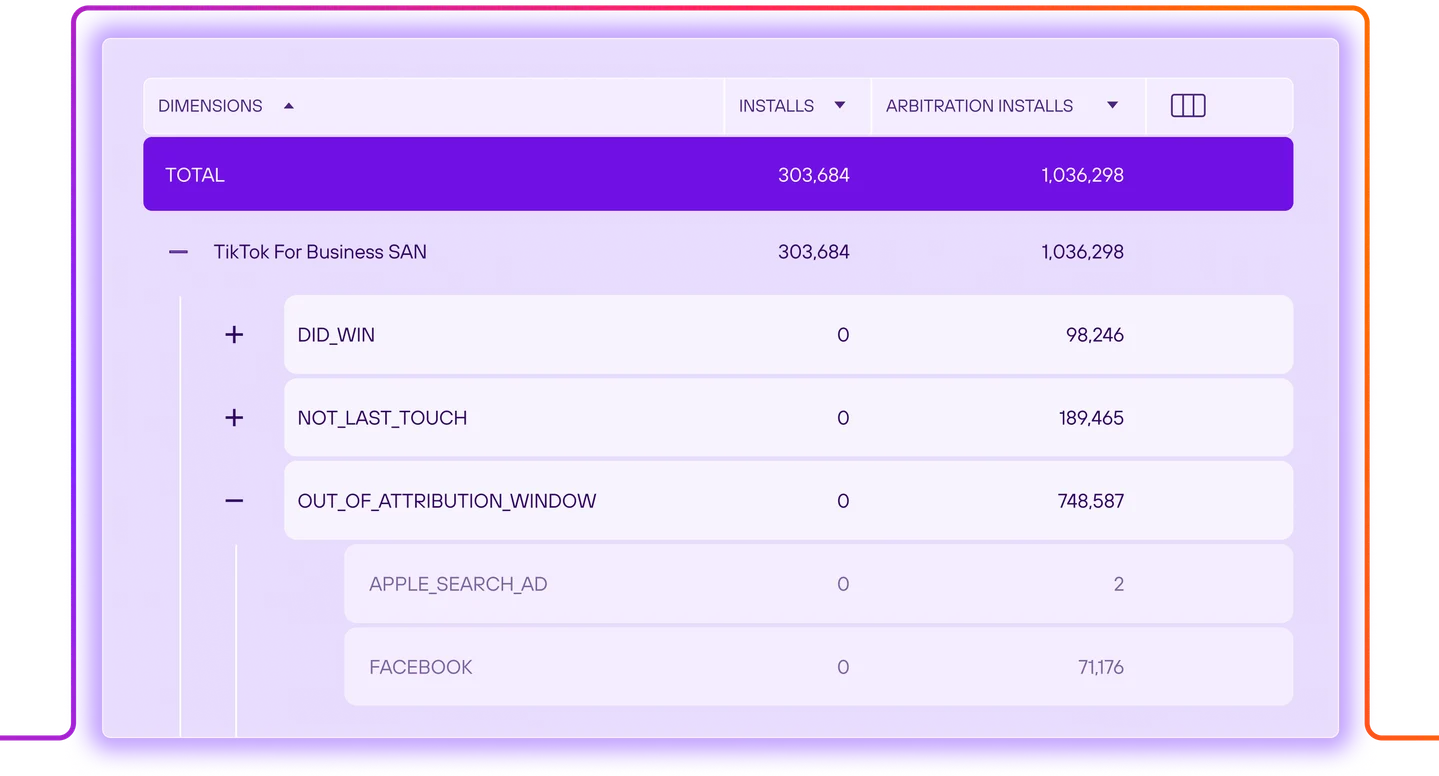
Pro tip: Meta and TikTok report installs and reinstalls as a single event. If your event configuration maps reinstalls to installs, combine Branch installs and reinstalls before comparing against those networks’ install counts.
2. Group campaigns and creatives your way with Sets
Every team has its own way of organizing campaigns. You might compare tier one markets with the rest of the world, or break performance out by creative concept. Ad partners and mobile measurement partners (MMPs) only report on their own preset dimensions, though, so building those custom views usually means extra work outside the platform. Sets let you build those groupings directly in Branch, so you can report on the categories your team actually uses without rebuilding them every week.
What’s new
Sets are custom dimensions you build inside any Analysis widget. You pick the columns you care about, like campaign name or creative name, and decide which values belong in each group. Branch then reports on those groups like any built-in dimension or attribute.
Try it
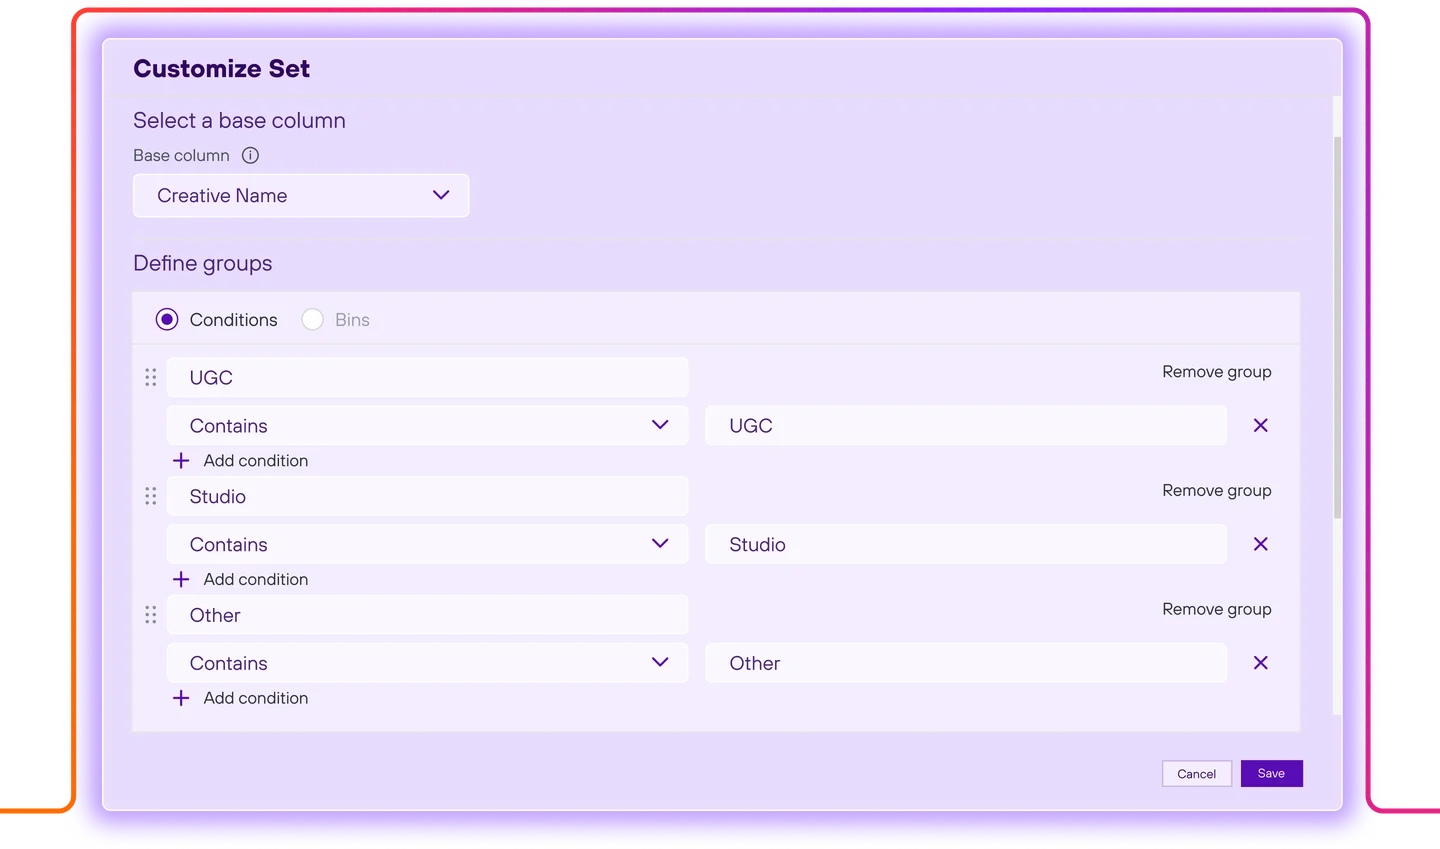
Say your team tags creative names by concept, like “UGC” or “Studio.” Here’s how to compare those concepts across every network:
- In an Analysis dashboard, create or edit a widget, select + Add, and choose Query set with Creative Name as a base column.
- Create a “UGC” group for every creative name that contains “UGC” and a “Studio” group for every name that contains “Studio.” Add an “Other” group to catch everything else.
- Name the set, add a measure like installs, revenue, or spend, and select Go.
Each row will show combined performance for each concept, across every ad partner that ran it.
Pro tip: Try grouping tier 1 markets to compare performance by region, separating seasonal pushes from evergreen campaigns, rolling campaigns up by product line, or grouping creative elements from an asset together.
3. Build the custom metrics that matter to your team with Formulas
Branch comes with the core metrics most teams need to get started. Formulas let you go further. Whether your team calculates cost per subscriber or watches installs per thousand impressions, you can build that metric once and use it in any report.
What’s new
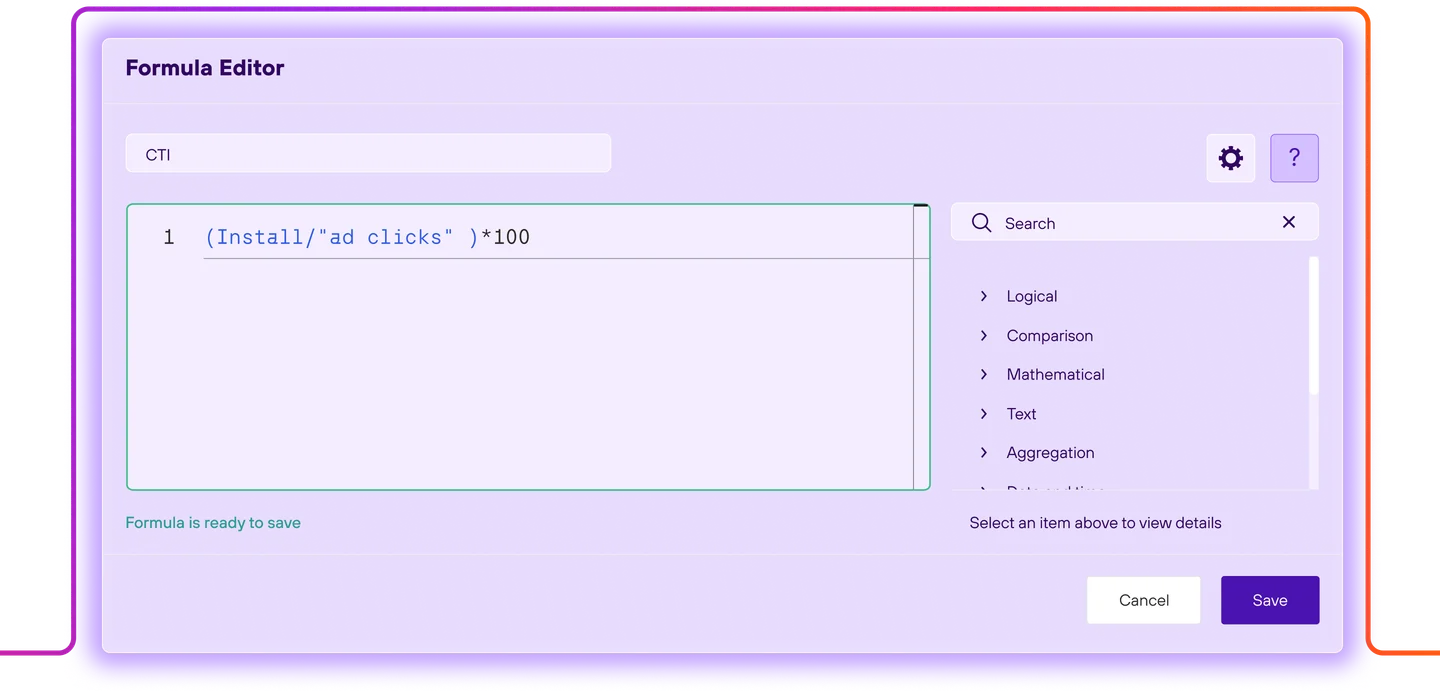
Formulas are custom calculations you add to any Analysis widget. Select + Add to create one, then write it in the free-form editor or build it from the pre-built functions.
Try it
Say your creative team wants to track installs per thousand impressions (IPM) across campaigns.
- In an Analysis dashboard, create or edit a widget and select + Add to create a formula.
- Write a formula to divide installs by impressions and multiply by 1,000.
- Name it “IPM” and add Campaign as a dimension.
Now IPM will show up right alongside the rest of your campaign metrics.
Pro tip: Formulas get even more useful when you pair them with Sets. Build a cost per subscriber formula by dividing spend by subscription starts. Then, add a channel grouping set, like paid social vs. paid search vs. CTV networks, as the dimension. You’ll see which channel grouping set brings in subscribers most efficiently, with each group spanning several networks.
4. Leave context where your data lives with sticky notes
Data is a lot easier to act on when someone walks you through it. Sticky notes let you add context directly to your Dashboard, so teammates and agency partners can see how to read the data or which targets to compare it against.
What’s new
Sticky notes are text notes you can add anywhere on an Analysis dashboard, alongside your widgets.
Try it
Say you’re sharing a paid campaign dashboard with your wider team.
- Add a sticky note at the top with instructions for reading the dashboard, such as which widgets to check first and how to compare your results to industry benchmarks.
- Add sticky notes at the top of your marketing channel performance report with each channel’s click-through rate (CTR) target.
Now anyone who opens the dashboard will be able to contextualize the data against established targets.
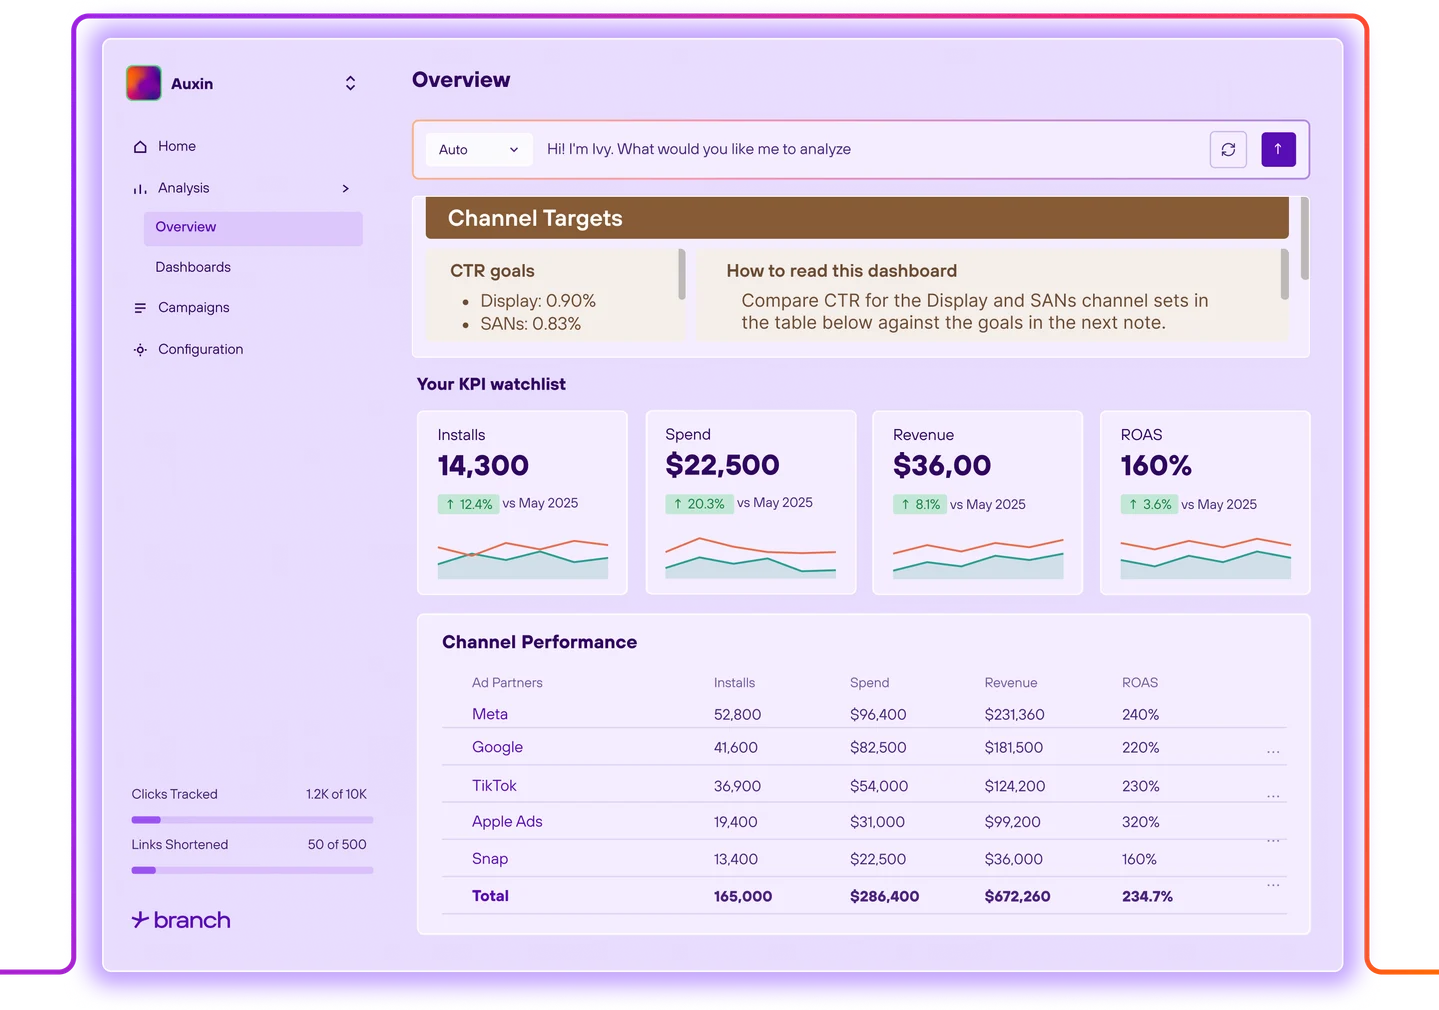
Pro tip: Sticky notes also work as a running log. Mark a promo launch or app release on a trend line, or flag an anomaly for your customer success manager to investigate.
Get started in the new Branch experience
The new Branch experience brings linking, measurement, reporting, and AI-powered insights into one workspace, so your team can see what’s driving growth and act on it faster.
Once you’re in, pick one of the features above and try it with your own data.
To get started on the new Branch experience, reach out to your account team.