Marketers know how their campaigns are performing. They know which owned channels convert best, which paid partners are pulling their weight, and which click-to-install rates (CTIs) and install volumes to expect from their channel mix. They’ve built expertise around their own data.
What they don’t have is context.
Without a way to compare performance against peers, even strong numbers exist in a vacuum. Teams of all sizes and budgets are experimenting with different marketing strategies, testing new ad formats, and diversifying their channel mix — all without knowing how they measure up to the market. The industry reports that do exist are published infrequently, cover only a slice of the picture, and don’t let you run a side-by-side comparison against your actual competitors.
Branch’s new Industry Benchmarks changes that.
How Industry Benchmarks work
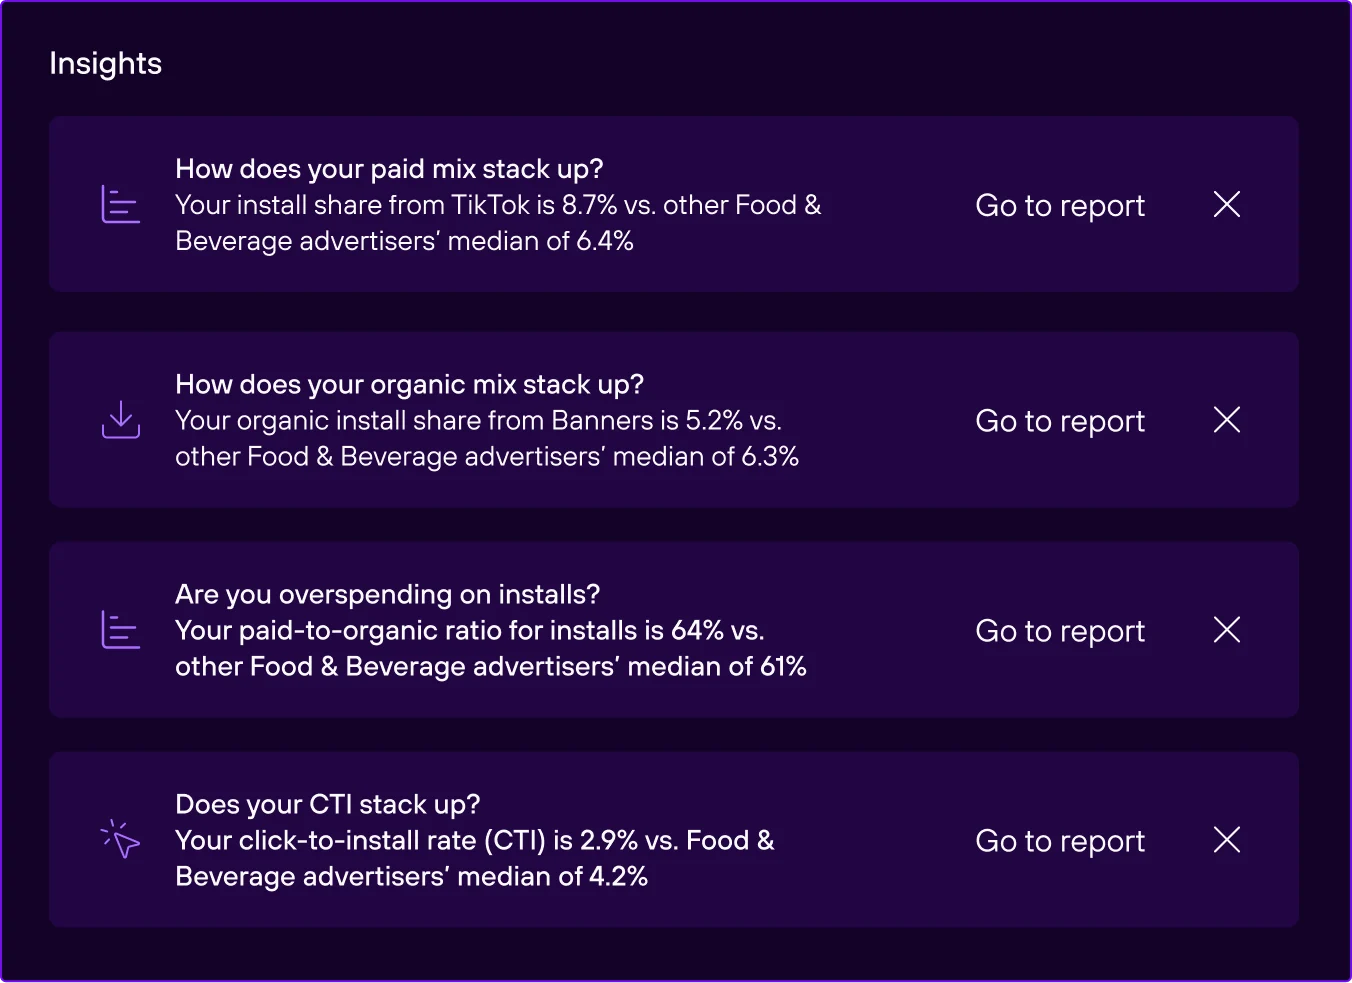
Industry Benchmarks provides vertical-specific competitive insights from app brands across industries like lifestyle, fashion, food and beverage, finance, health, gaming, and more. Ivy, Branch’s integrated AI, proactively surfaces insights to compare your app’s performance against industry medians.
Industry Benchmarks also includes a dedicated dashboard with five widgets that expand on the insights Ivy surfaces. That means you can analyze how your investment levels and engagement rates compare to peers across specific paid networks and organic channels. KPIs include:
- Paid install share vs. vertical median: Compare your paid channel mix against the industry median. See whether you’re over- or under-indexed on specific ad networks like Facebook, Google, or TikTok.
- Organic install share vs. vertical median: Compare your organic channel mix against the industry median. See where your organic strategy aligns, or departs from, what peers are doing across channels like QR codes, SEO, banners, and email.
- Paid vs. organic install ratio: Compare your split between paid and organic installs against the industry median. Identify whether paid spend is cannibalizing your organic growth.
- Paid CTI ratio: Compare your conversion rate by network against the industry median. Validate whether low conversion is an individual problem or an industry-wide pattern on that network.
- Organic CTI ratio: Compare your conversion rate by organic channel against the industry median. Contextualize engagement on your owned channels and set realistic performance benchmarks.
Together, Industry Benchmarks give your team the context and justification for smarter optimization decisions and strategy deployment.
Why Branch’s benchmarks are different
Branch serves Fortune 500 companies across diverse industries, which means our competitive analytics are actually relevant and tailored for your business. Other tools tend to focus on granular gaming verticals or don’t have network-level breakdowns. Branch is the only one to bring you both.
A few things that set Branch apart:
- Data gets updated daily, not published at infrequent cadences.
- Insights are vertical-specific and targeted to your specific category, not generic industry averages.
- Benchmarks are built into Branch, right alongside your performance data, which means no separate tools or fragmented workflows.
- Insights are built on the same data foundation that powers Branch’s attribution, not modeled estimates.
The new Branch experience
Industry Benchmarks isn’t just a cool new reporting capability — it’s the newest addition to Branch’s AI-powered Intelligent Analytics and part of the new Branch Platform. We didn’t just reskin the old UI and layer on AI. We rebuilt the platform from the ground up to streamline the way you work. Instead of tab-switching, manual tagging, and static reports, the new Branch Platform provides a unified analysis engine, smart link creation, and integrated AI.
Branch powers everything from the user journey, to the measurement, to the insights and analytic workflows. With the platform rebuild, those foundational capabilities got a serious upgrade — and together, they help marketers streamline their day-to-day and make smarter optimization decisions faster.
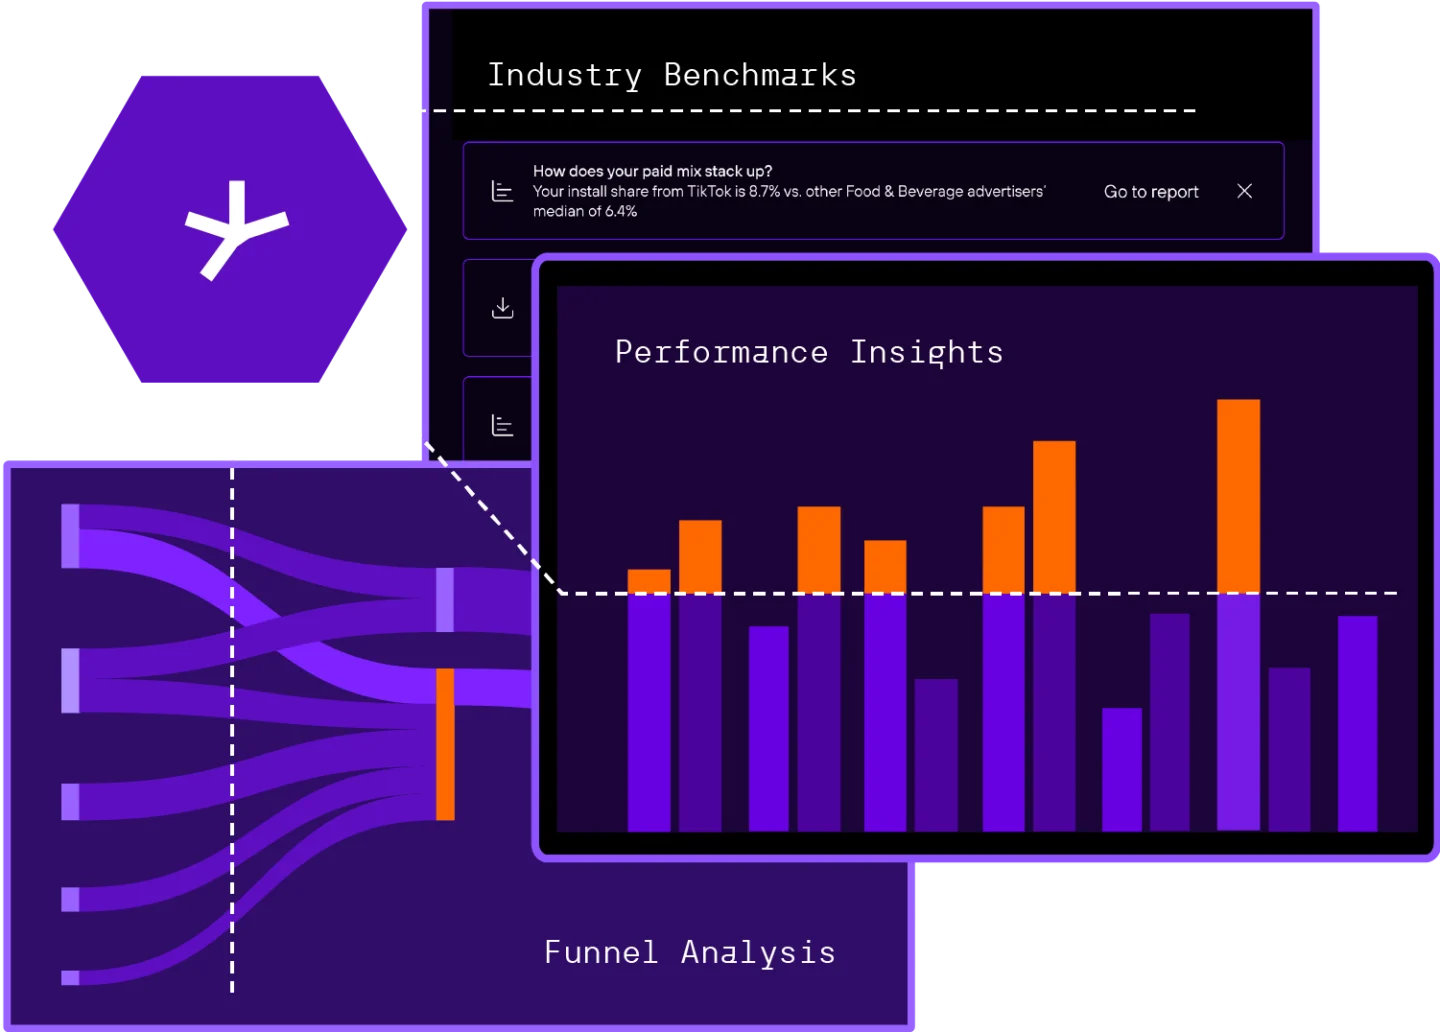
Intelligent Analytics means more than a dashboard. Here’s what’s inside:
- Performance Insights surfaces partner-level cost per click (CPC) and cost per install (CPI) trends month-over-month, with automatic signals for your biggest improvements and declines by ad partner. It answers: What’s shifting in my spend?
- Funnel Analysis maps every conversion path across clicks, impressions, web, connected TV (CTV), and app, showing not just who converted, but every touchpoint that influenced the journey. It answers: Who drove this, and where did I lose them?
- Industry Benchmarks adds the competitive layer that ties it all together. It answers: How does my performance compare?
How to get started
Already working with Branch? Industry Benchmarks is available now in Branch’s new platform. Insights surface on the homepage, and deeper competitive analysis lives in the dedicated Benchmarks Dashboard. Check out our help center documentation to see what’s available based on your current Branch solution.
Not on Branch yet? Talk to a Branch expert and learn how Industry Benchmarks can give you the competitive context your team needs.