
Industry Benchmarks
See how you stack up to top apps in your vertical
Compare your performance against vertical peers to identify channel-level trends, opportunities, and targets.
Trusted by 100,000 brands since 2014


what it solves
Without context, even strong performance is just a number
Get vertical-specific insights that compare your performance to real peers, not a catch-all category.
core capabilities
Compare your performance at every level
Our customers say it best
We’ve been trusted by more than 100,000 brands since 2014 to deliver flawless customer journeys.
“No one gives you a pat on the back for increasing click-through rates or app downloads. It’s about translating the analytics into real business outcomes, and that’s where Branch comes in. Branch helped us understand where we were hitting a ceiling on growth, so we could deploy our budget where it actually moved the needle.”
Rahul Mishra
Head of Performance & CRM

“As we expand our paid ads programs to new ad networks, we can now get immediate feedback on what’s working and what’s not working with Branch analytics.”
Abdulrahman Madkhali
Marketing Manager

“Our conversion volumes are up by 1.5x compared to last year, and the overall quality of the mix has improved. From a reporting and analytics perspective, Branch played a very critical role for us to get the entire picture.”
Jaskaran Singh
AVP Growth

explore more
Make every connection count
Combine industry context with the measurement and strategies that turn it into growth.

Multitouch analytics
Look past the last touch to see every channel, platform, and device that influenced a conversion.

Cross-platform attribution
Connect touchpoints from every channel with conversions on any platform.

Web to app
Convert web visitors into loyal app users with deep links that carry them from the browser to the right in-app screen.

AI solutions
Get insights, automation, and natural-language answers with AI solutions that only use your data.

SEO and AEO attribution
Attribute app installs and in-app events to the search engine or AI platform that drove them.

Web attribution
Measure web, desktop, and web-to-app journeys, and connect every visit back to the campaign that drove it.
Frequently asked questions (FAQs)
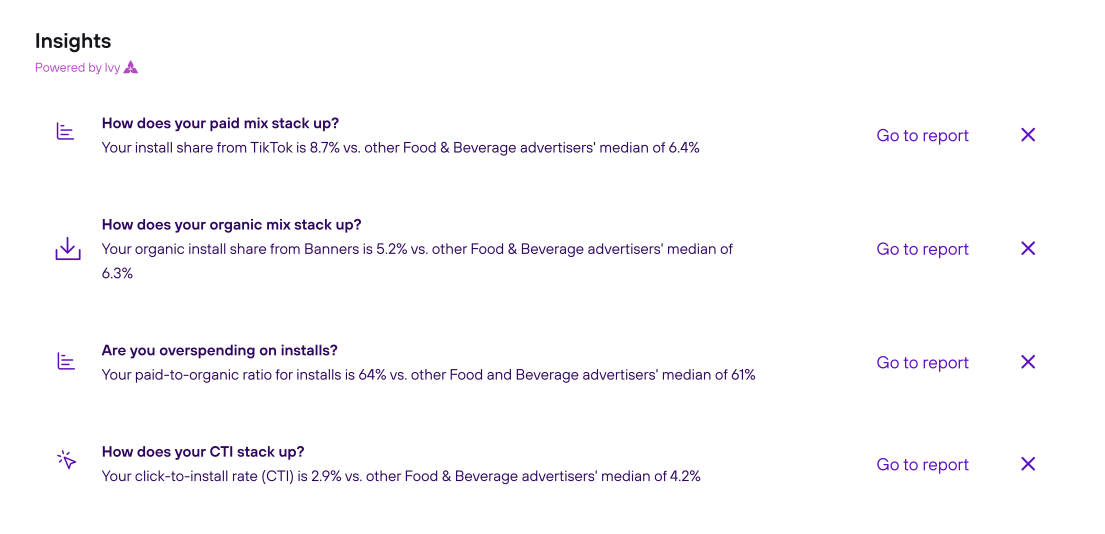
Branch’s Industry Benchmarks compare your performance side by side with other apps and brands in your vertical across paid and organic channels. Benchmark data updates daily and uses a rolling 30-day window. Ivy, Branch’s integrated AI, surfaces daily benchmarking trends for quick insights.
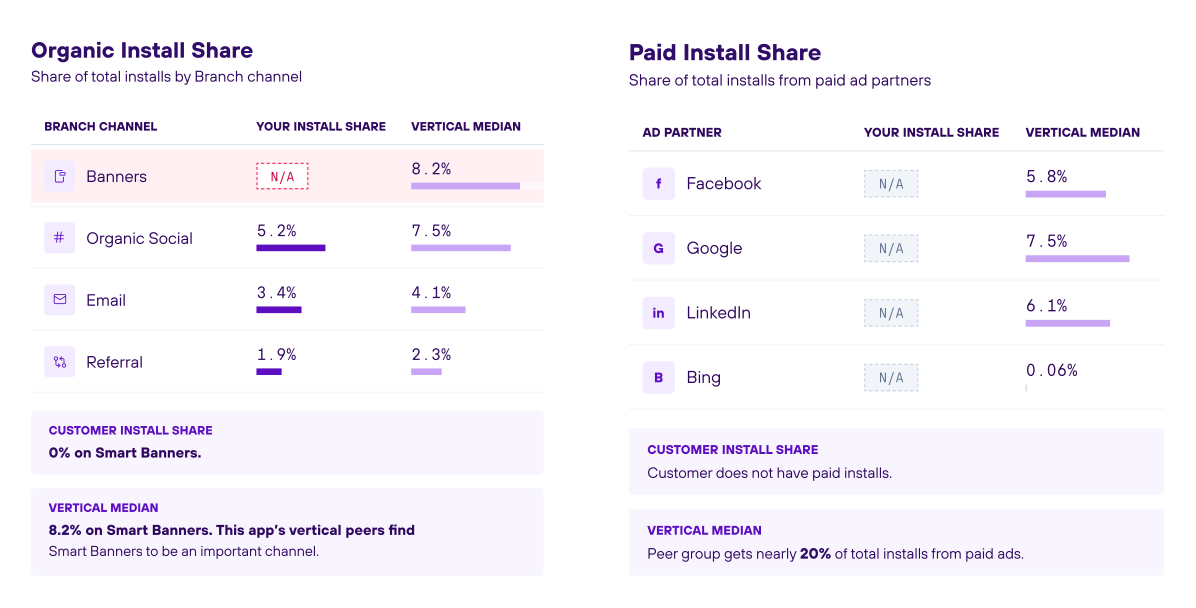
Branch Industry Benchmarks compare four install-based metrics against your vertical’s median: paid install share by ad partner, organic install share by channel, paid-to-organic install ratio, and click-to-install rate (CTI) by channel. You can view each metric by network, such as Meta or Google, or by channel, such as email or organic social.
Benchmarks show whether you’re over- or under-investing in specific ad partners compared with other apps in your vertical, and where you might face less competition. You can also see how your organic channel mix stacks up, how much you rely on paid installs, and whether your conversion rates reflect your own campaign performance or are typical for that channel.
Branch Industry Benchmarks supports 14 verticals, including entertainment, fintech, food and beverage, gaming, healthcare, lifestyle, marketplaces, news media, retail (fashion), retail (non-fashion), telecom and utilities, tools and productivity, traditional finance and insurance, and travel. Each vertical is evaluated daily to ensure verticalized data meets technical safeguards and minimum threshold requirements.
Branch Industry Benchmarks’ data is derived from the same first-party data that powers Branch attribution. We apply technical safeguards to protect customer’s proprietary strategies and identities.
Branch Industry Benchmarks protects sensitive customer data by aggregating and surfacing median values. To protect anonymity, Branch applies minimum threshold requirements to verticals. Data that doesn’t meet these thresholds doesn’t get surfaced.