
Branch’s Web SDK has several uses, including powering our Journeys web-to-app smart banners product, event tracking, web attribution, and facilitating deep linking on the web. After integrating the SDK, clients frequently ask about the best way to test that it is set up properly. This blog post will walk you step-by-step through testing the Branch Web SDK integration on your website. By following these steps, you can help ensure a seamless experience for your users and maximize the power of Branch’s Web SDK for user acquisition, reengagement, and analytics.
Step 1: Check the Integration Status tab
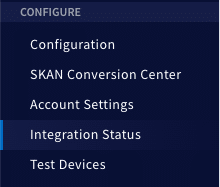
For a high-level look at how close the integration is to completion, check the Integration Status tab in your Branch Dashboard. When you log in to the Branch Dashboard, you’ll find the Integration Status tab on the left sidebar underneath the Configure section:
On this page, scroll down to the Web SDK section, and you will see a percentage score that indicates your overall integration progress.
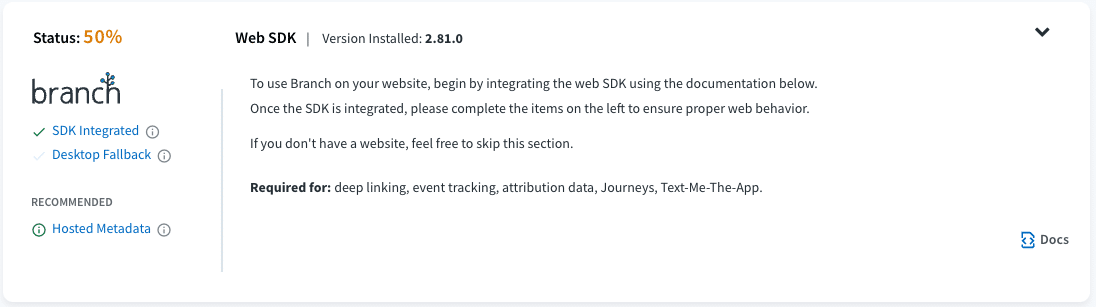
While the Integration Status tab is a good first indicator of your progress, it does not necessarily indicate that everything is set up properly. Once all items on the page show 100% completion status, or if you are unsure how to complete a specific item, investigate further using dev tools.
Step 2: Utilize dev tools to confirm the network calls
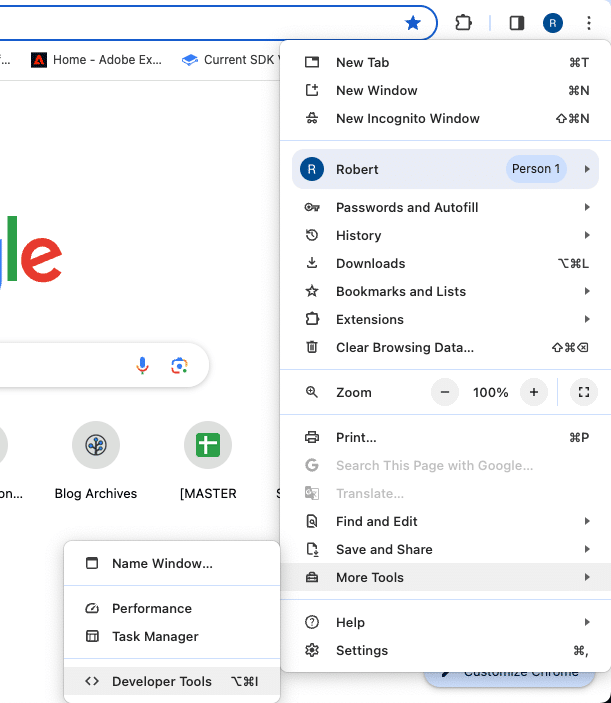
Nearly every major browser has a set of dev tools that you can utilize to examine the network calls made by a webpage. Since Branch’s Web SDK sends requests to the Branch server, you’ll want to ensure that the correct requests are made at the appropriate time. You’ll also be able to confirm if the responses sent from the Branch server to the website contain the expected data. For our example, we will use the Google Chrome Dev Tools. You can acess these by opening a Chrome browser, clicking the ellipsis icon on the upper right (three dots), and going to More Tools > Developer Tools.
Next, open the website that has the Branch SDK integrated. Then, open the Network tab of the Chrome Dev Tools.

At this point, the expected behavior of the Branch Web SDK is to make four network calls. We’ll take a detailed look at each of these in a moment, but here is a high-level overview of what each does:
- The first request, labeled branch-latest.min.js, indicates the presence of the Branch SDK on that webpage.
- The second request, delineated in the screenshot below, starts with _r?sdk=web and indicates that the Web SDK has been initialized.
- The third and fourth requests are both pageview events (we’ll discuss the difference between the two in a moment).
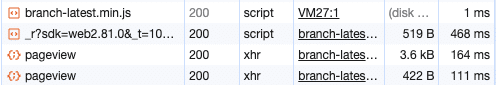
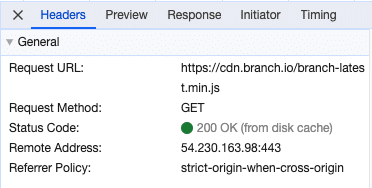
Ensure that all four of these requests have a status code of 200, meaning that they were successful. If any of them have an status code in the 400s, it means there is an issue from the code on your webpage. A status code in the 500s indicates a server error. Select each of the network calls, then click the Headers tab to see the Status Code for a given network call.
If you see a call with branch-latest.min.js but not one starting with _r?sdk=web, it means that you have added the Branch SDK to the webpage but it isn’t getting initialized. Some common reasons this can happen are:
- You are injecting the SDK through a tag manager but not through a Custom HTML tag.
- Your website is set up as a Single Page Application. (In this case, you’ll need to manually track a pageview event through the Branch SDK each time the content on the page is updated.)
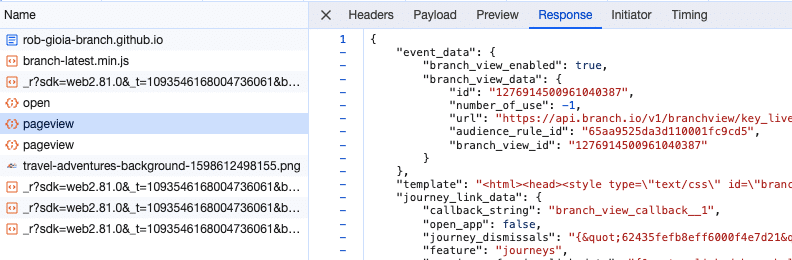
Pageview events are a critical piece of the Branch Web SDK’s functionality. If set up correctly, you should see two of them. Clicking pageview will show the details of the network call. If there are request or response bodies associated with the network call, you will be able to click on the tabs labeled Payload or Response to view them. The response for the first pageview should have metadata associated with it:
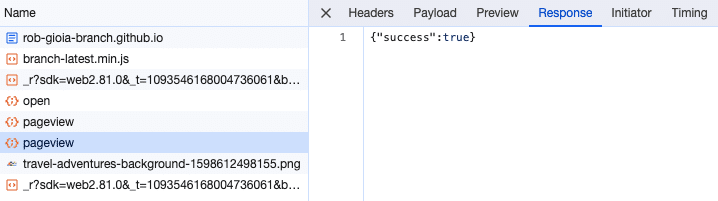
The second pageview event will have a much smaller response, letting you know if the Web SDK initialization succeeded or failed.
Once you’ve confirmed that the four network calls are coming through correctly, you are ready to proceed to step three.
Step 3: View web events in Branch Liveview
Now that you’ve confirmed the Web SDK is successfully integrated and getting initialized on the website, the next step is to check that any tracked web events are firing properly. Any customer using Branch’s Web SDK can perform the following checks on events tracked automatically by the Web SDK: web session start and pageview. A simple way to verify this is to use Branch’s Liveview tool.
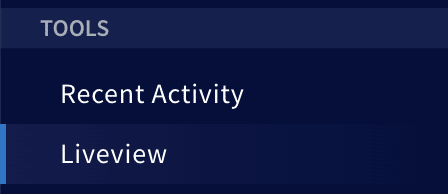
On the left sidebar of the Branch Dashboard, you will find Liveview under the Tools section.
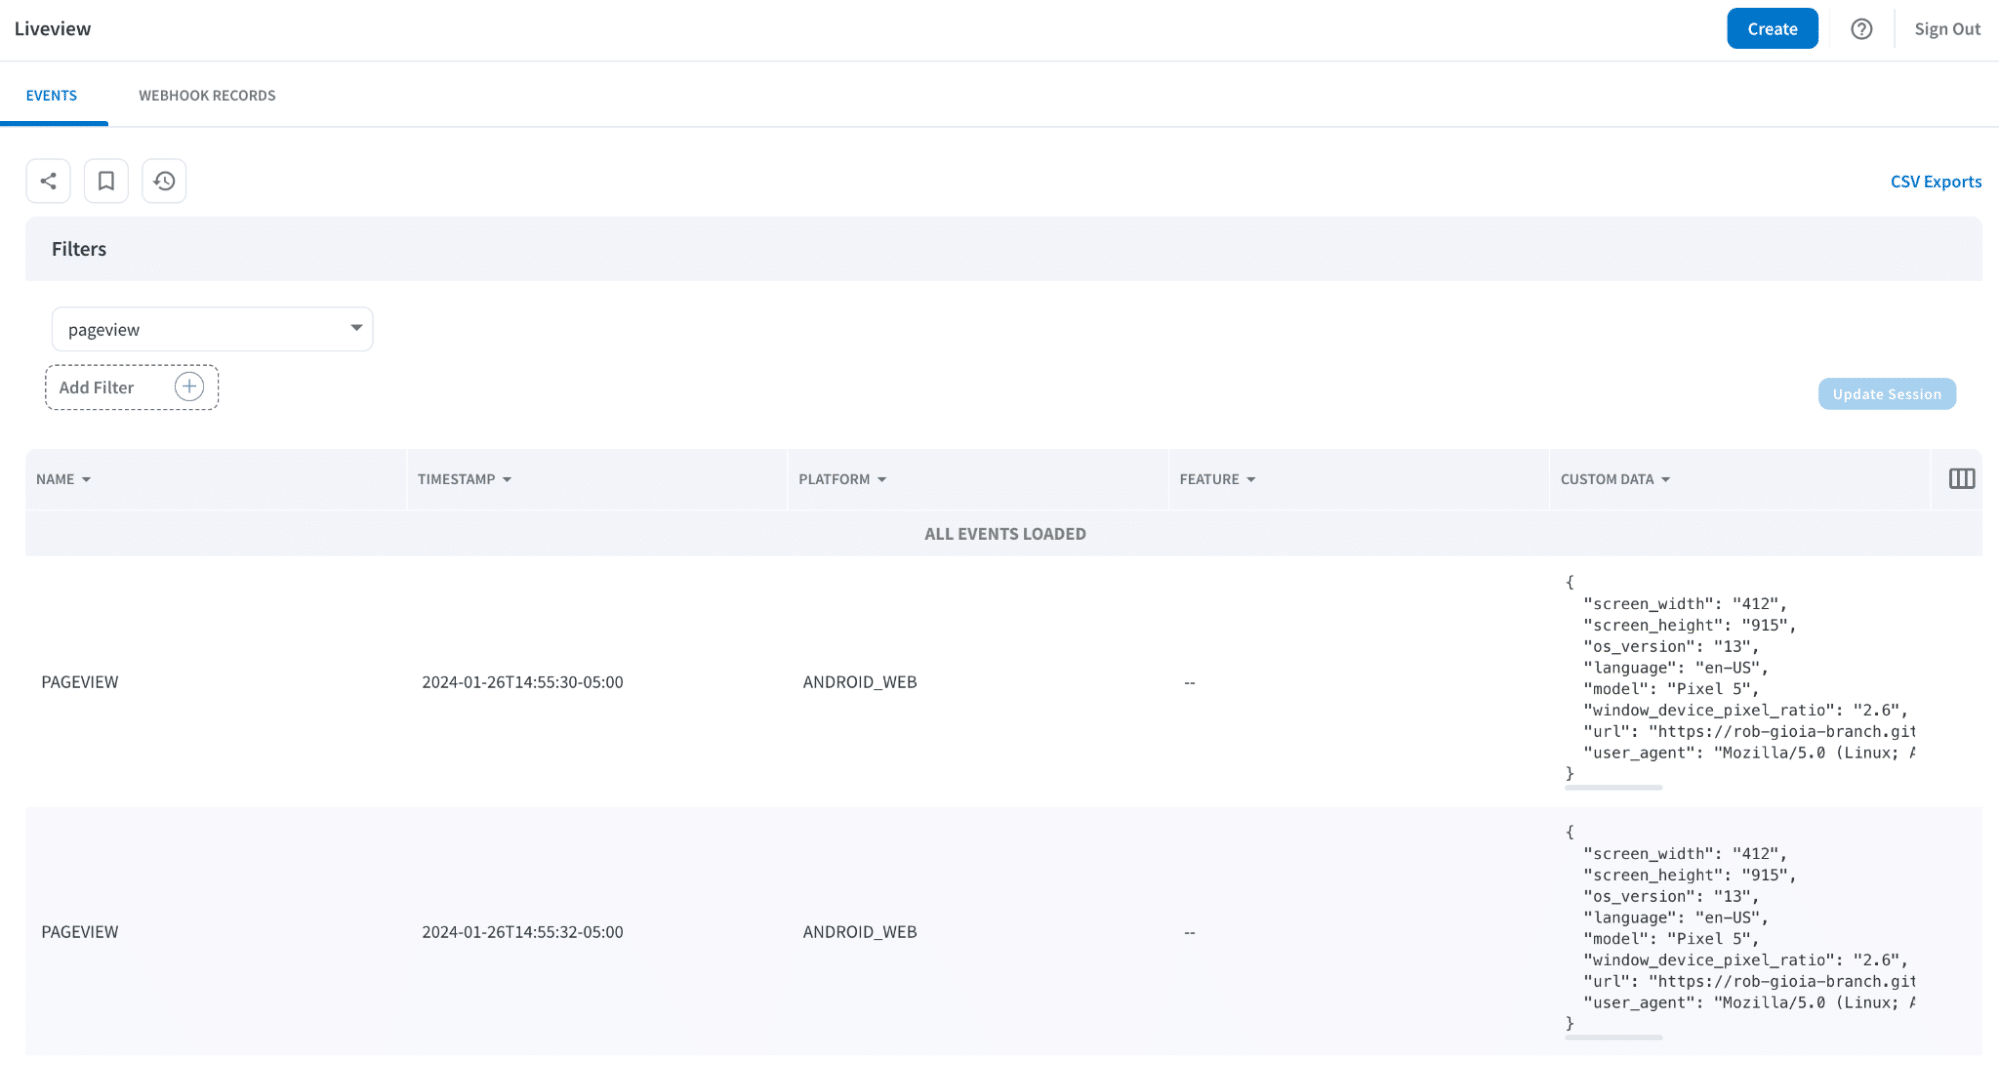
In this section of the Dashboard, you can filter by type of event, like pageview, then view events in real time (with up to a 2-minute delay) when you perform them on the webpage. You’ll also be able to see other metadata fields on the event, such as any custom data attached to the Branch Web SDK or custom attributes you programmatically added.
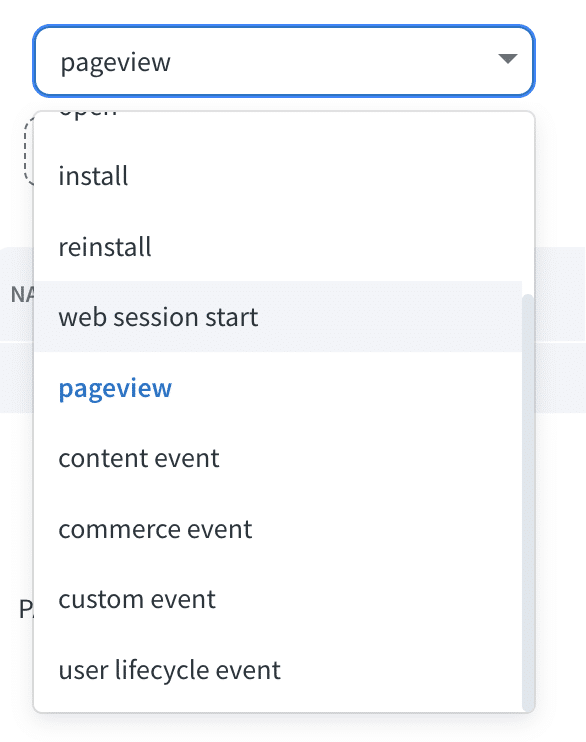
Customers utilizing Branch’s Journeys product can perform the same validation for the Branch CTA view event that is automatically triggered whenever a Branch Journeys banner is displayed on a webpage. Additionally, if you track any web events through Branch, you can change the filter to content event, commerce event, custom event, or user lifecycle events, and perform the same checks.
Don’t forget to click the Update Session button anytime you update the filter to apply the change.

Once you’ve verified that the data is correctly flowing into Branch, you are ready to move onto the next step.
Step 4: Launch an end-to-end Journey test on a test environment
Analyzing events and data is great but there is no replacement for actually launching a Journeys banner on a test environment and validating the behavior on your device. This will allow you to see exactly what the user will experience when viewing and interacting with a Journeys banner on your website.
Validate & Test is the final step on the Journeys creation flow and looks at both the required and recommended steps in the Validation section. The required steps include having a valid audience to display the Journey to and integrating the Web SDK on the page where you intend to display the Journey.
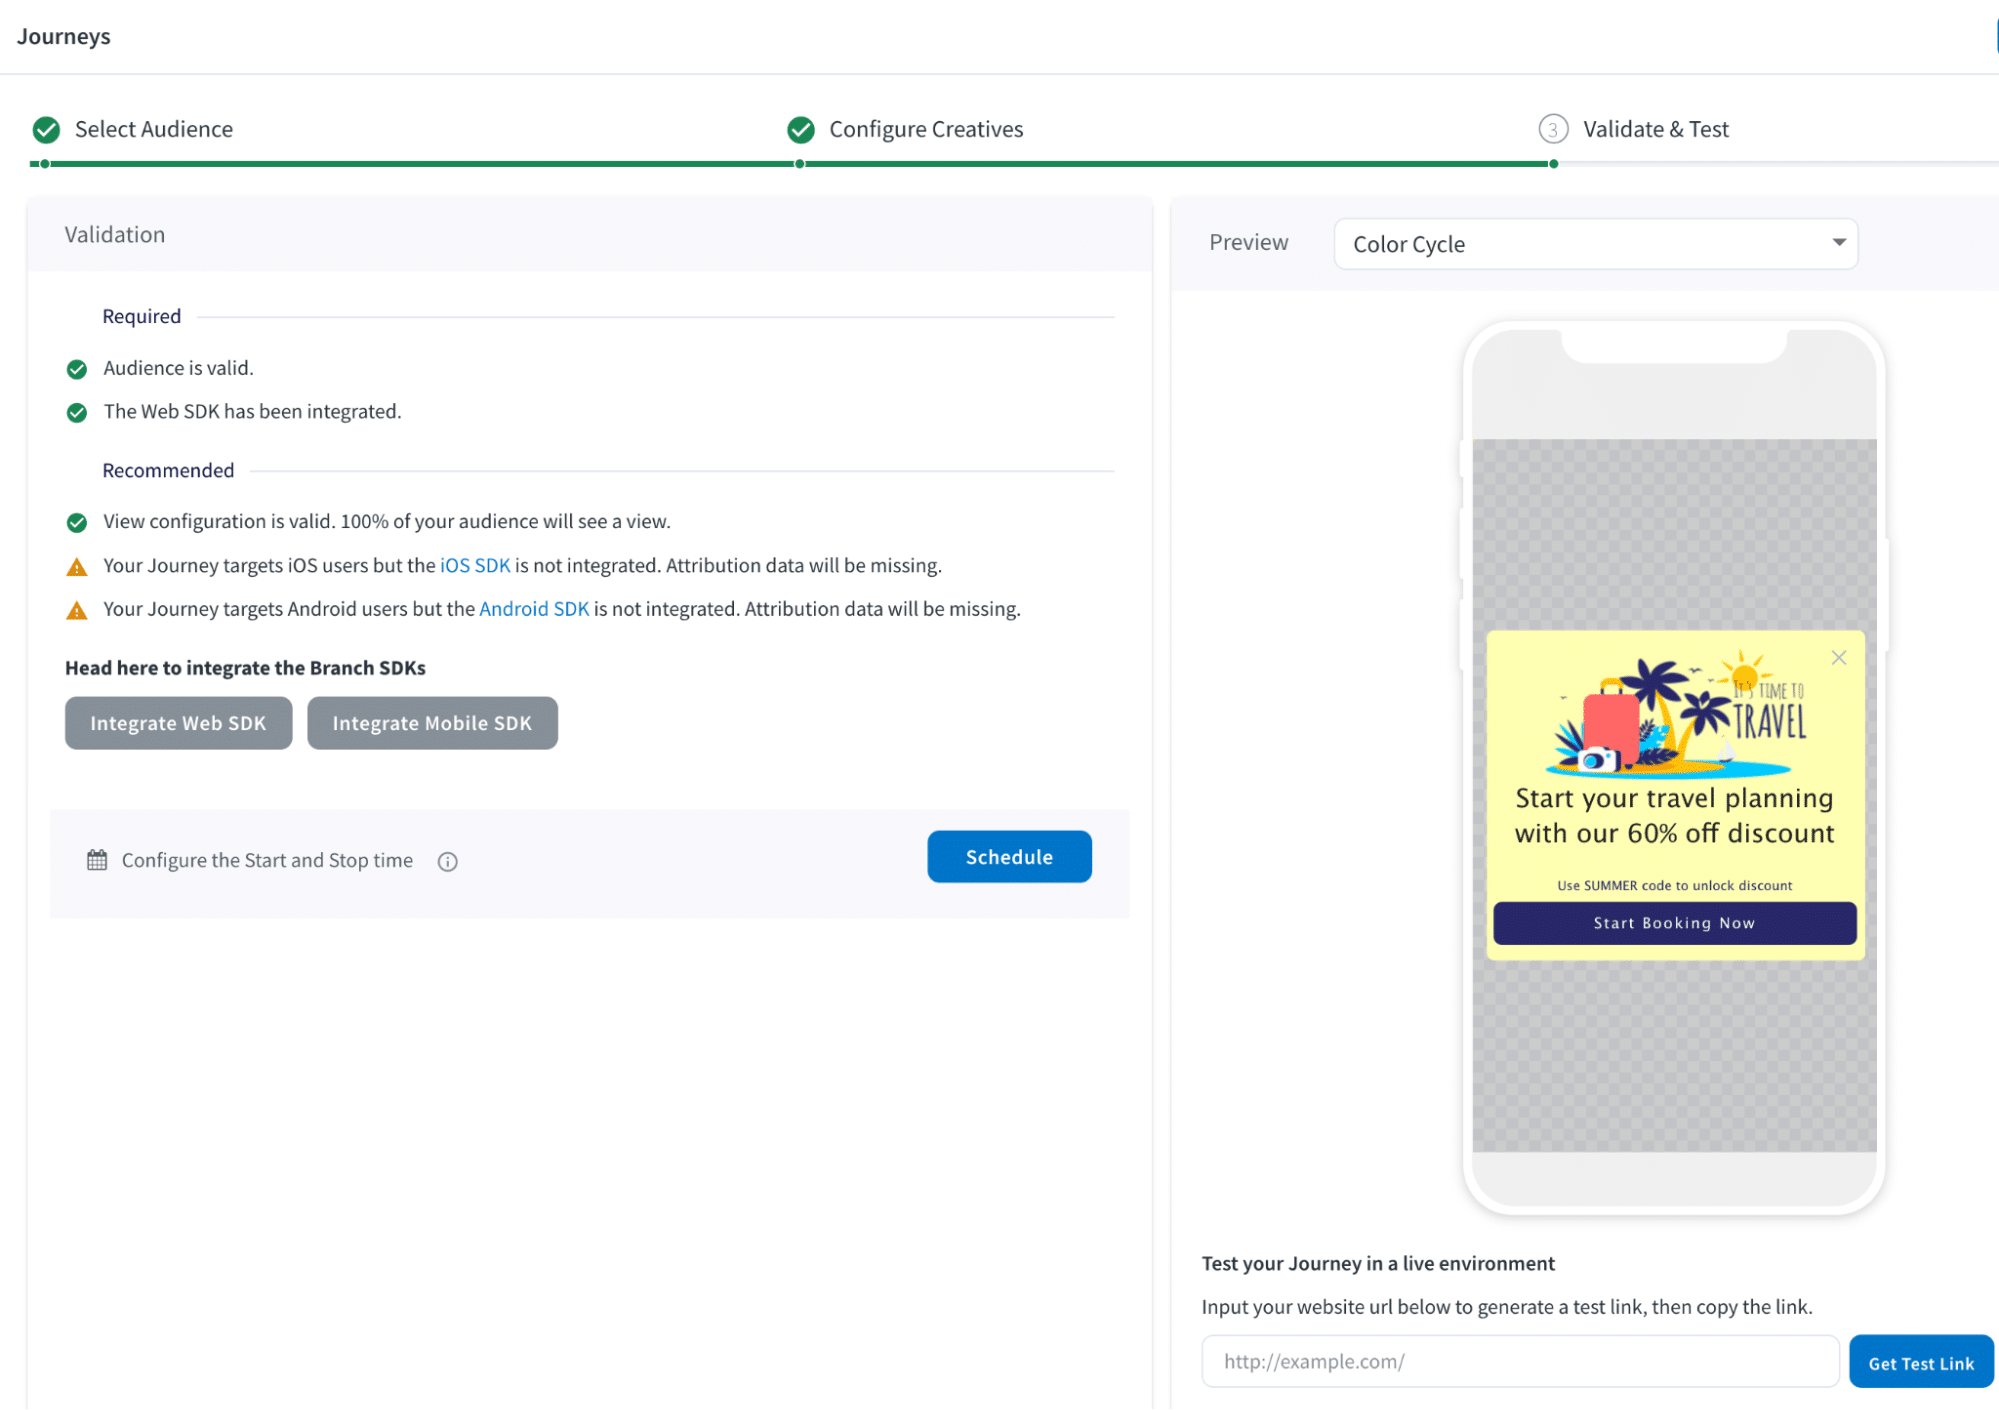
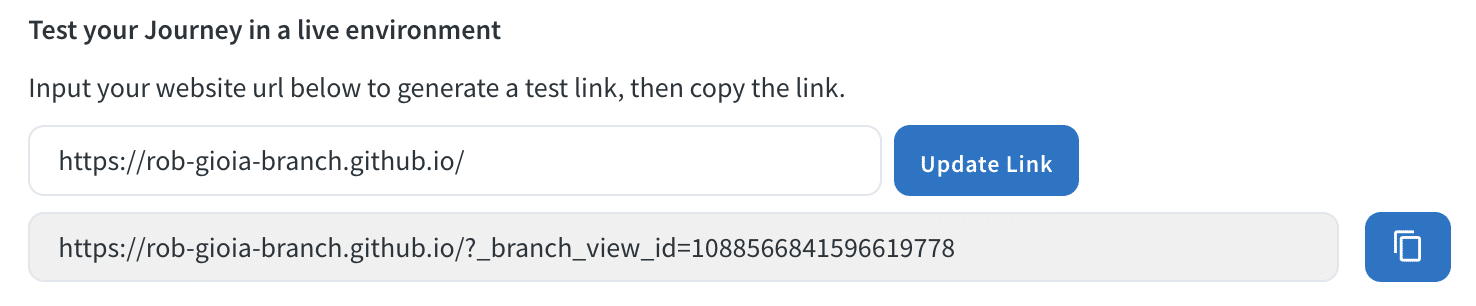
On the right hand side is a preview of the Journey along with an input field where you can enter a URL and create a test link. By using this link on your mobile device, you can see how the Journey will look for the end user.
It is important to note that test links do not take filtering criteria into account, so you’ll still need to launch the Journey on your test environment and verify that any users that meet the filtering criteria see the Journey, and vice versa.
Keep in mind, the experience when a user clicks a Journey is powered by a Branch link “under the hood.” So, if your QA team is testing across devices, or you want to automate testing by creating unit tests, you can retrieve the Branch link behind any Journeys banner by utilizing the browser dev tools. In the Network Tab, filter all requests by “branch” and inspect the “https://api2.branch.io/v1/pageview” request. Under Network Response, search for “app.link” to find a reference to the actual link that was embedded behind the button. You can then copy this link and append “?debug=1” to inspect its data.
By following these steps, you can thoroughly test your Branch integration and ensure a great user experience for every user who clicks on a Branch link, no matter what the scenario.
Have questions? Reach out to your account team.
Want to learn more about getting started with Branch? Request a demo!