RESOURCES
Topics
Persona
Types
Blog
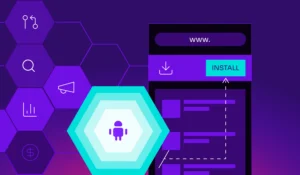
Android smart app banners help convert mobile web visitors into app users by enabling app detection, deep linking, attribution, and optimized user journeys across browsers.

Blog
AI changed how people find things, but measurement hasn’t caught up. Branch’s Adam Landis and Victorious’ Jason White break down the gap and what marketers can actually do about it.
Blog
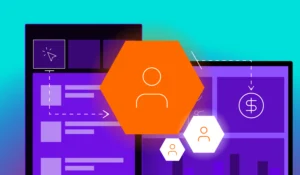
Discover how modern mobile app user acquisition strategies connect channels, measurement, and retention to drive sustainable growth, maximize LTV, and improve marketing efficiency.

Blog
Branch Monster Factory is a developer demo app for exploring the Branch SDK hands-on. The latest version adds gamified challenges, an onboarding flow, and production-grade sample code. Available now on iOS and Android.
News
Paula Mantle, VP of Marketing at Branch, discusses trust driven marketing, privacy first personalization, CTV growth, and the future of the Agentic Web.

News
Branch’s CEO David Karnstedt shares how AI is transforming marketing, customer engagement, and product development.

News
Branch’s Head of Strategic Growth Adam Landis discusses how marketing executives view AI search and its rapid growth in the digital landscape.

News
Branch’s Chief People Officer Christine Park discusses confident leadership during times of rapid change.

News
Forbes Communications Council shares top advice for new copywriters to differentiate themselves in an AI-powered workplace.