The success of a mobile app begins with user acquisition. While app marketers and developers have a plethora of paid options to grow their user base, finding the right starting point and the perfect mix of growth strategies can be daunting and costly for anyone. To help you devise a cost-effective user acquisition strategy, we have analyzed over 10 million app installs across the iOS and Android platforms, different marketing channels, social media platforms, and growth features to provide you with a click to install benchmark study to help you prioritize and optimize spend. To learn more, keep reading or request a Branch demo.
Methodology
Branch provides a mobile deep linking platform used by over 24,000 apps around the world. We process more than 2 billion deep links every month that are used to drive app installs and engagement. For this study, we have aggregated and analyzed link click data from April 2017 to show how effective different marketing channels, social media platforms, and growth features perform for driving app installs. Below are the major findings from this study.
Click-To-Install Rate by Branch Features
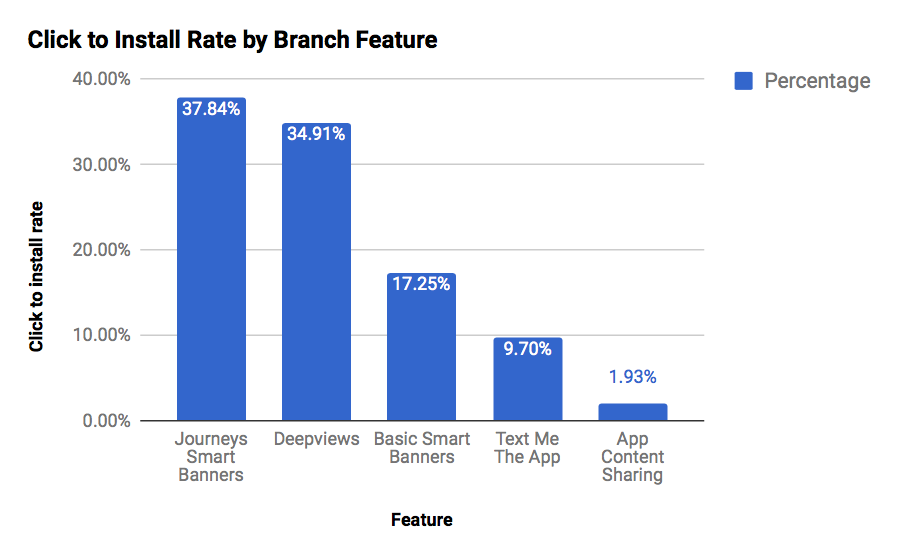
Many apps rely on Branch to build features that drive organic growth. For this study we have analyzed click-to-install conversions from some of the most popular Branch features. From the above chart we can see the most effective feature is Journeys, which are smart app banners with audience targeting capabilities to convert website traffic into app installs. Journeys are the most popular solution for businesses looking to convert mobile website traffic to app users who convert at 3x than mobile websites. One thing worth noting is that Journeys Banners (34.87%) outperform the basic Smart Banners (17.25%) by almost 200% for driving app installs, which is largely due to the audience targeting capabilities. Other factors that are likely to have contributed to Journeys’ high conversion rate include the abilities to execute A/B testing and custom-design the visual assets. Therefore, we strongly encourage companies with high mobile site traffic to leverage the Journeys product for optimal results.
Second on the list is Deepviews, which are auto-generated mobile web splash pages with app content previews and deep linking capabilities. Deepviews helps to reduce the friction during the app download process and is proven to drive up to 6X improvements in click-to-install rates. It’s also a free feature that can be easily implemented whether you have a mobile website or not.
Click-To-Install Rate by Marketing Channels
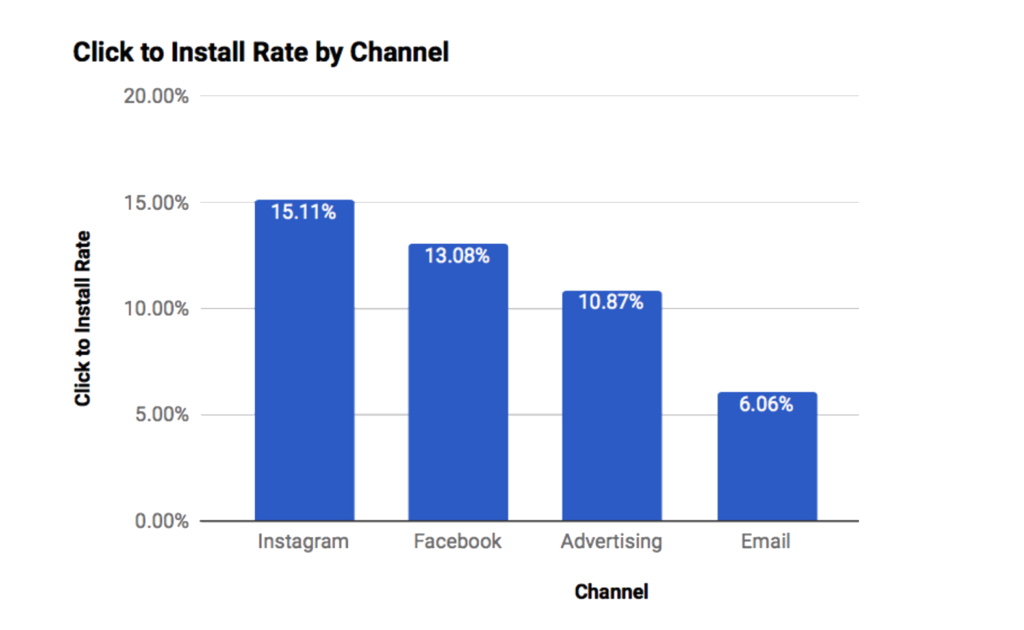
Next let’s look at the acquisition performance by marketing channel.* Based on the data, Instagram is the highest-converting channel, with a 15.11% click-to-install rate, and Facebook takes second place, with a 13.08% conversion rate. It’s not surprising that these channels performed better, given the rising popularity of social media in general. Advertising ranked third with a 10.87% conversion rate. One thing worth noting is that emails, traditionally regarded a channel for desktop marketing, despite some struggles with mobile, has become the 4th highest converting channel for driving app installs. As more email service providers (ESPs) ramp up mobile innovations by adding such critical functionalities as personalization, deep linking, and tighter integration with other channels, we believe email marketing will continue to rise in importance as a mobile marketing channel.
*Note: Utilized data is based on Branch link clicks and installs where “channels” are defined voluntarily by users.
Click-To-Install Rate by Device Platforms
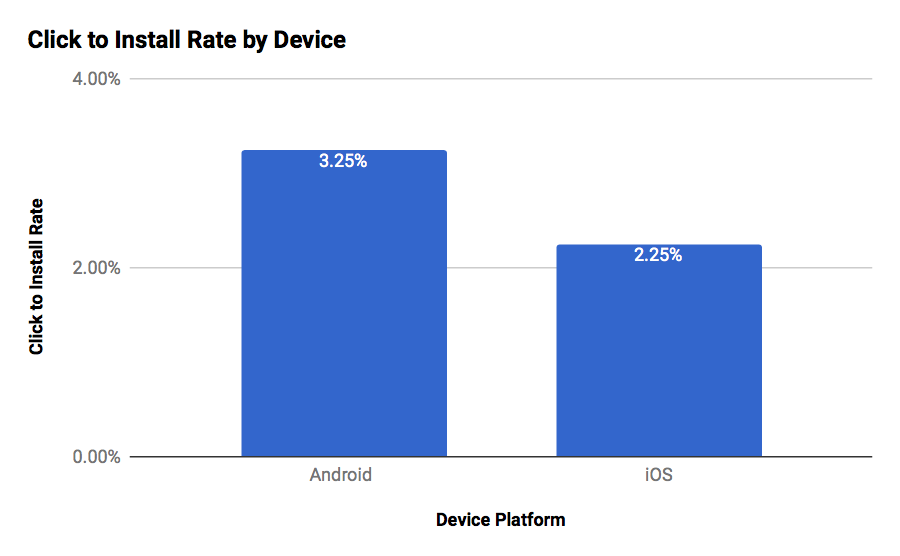
Here, we compare the two most important platforms in mobile for their click-to-install performance: iOS and Android. While the former may be a better platform for monetization, the click-to-install rate among iOS devices is actually lower than that among Android devices. This means the cost for app user acquisition is likely to be higher for iOS than for Android.
Click-To-Install Rate by App Categories

Finally, we have a roundup of install conversion rates by app category. This metric can be used to gauge the ease and cost of user acquisition for different types of apps. We’ve analyzed click-to-install performance across the seven most popular app types: entertainment, sports, eCommerce, lifestyle, travel, social networking, and news. The highest-converting category turns out to be entertainment, at 8.66%. Typical apps under this category include Netflix, HBO GO, and Hulu.
Conclusion
As with any other business, the importance of growth for a mobile app cannot be overstated. Even amidst the harsh power law and the increasing fragmentation in mobile, successful app growth is not insurmountable with the right strategies. Hopefully, the trends examined here can provide some directions and inspirations for you.
If you have any questions or thoughts about this report, please feel free to share them in the Comment section below.
Special thanks to Eric Glover and Kan Yu from our amazing Data team who have analyzed millions of link clicks to make this report possible.