
Over a year into Apple’s SKAdNetwork 4.0 launch, advertisers are still struggling to measure marketing efficacy on iOS. The simple fact is the privacy policies implemented by Apple reduce the ability to measure the outcome of paid media campaigns — by design. After deprecating the IDFA, brands are now faced with highly complex workflows and technology implementations that lead to worse outcomes.
At Branch, we’ve covered the SKAN 4.0 framework in depth, published comprehensive recommendations on setting conversion value schemas, and recently launched the SKAN Magic Set Up, which helps advertisers make the most of SKAN.
SKAN Magic Set Up helps marketers get the most reliable signal from a campaign — given the limitations introduced by the SKAN framework.
While the aim of this product is to make our customers’ jobs easier, SKAN Magic Set Up uses intricate, innovative technology. To get more background as well as practical advice for putting it to work, I sat down with Branch data scientist Blake Schiafone to learn a little more about how SKAN Magic Set Up works and how Branch customers can use it most effectively for their campaigns.
— Adam Landis, Head of Growth at Branch
I’ve heard the product and engineering team’s excitement about this launch, so I’m looking forward to hearing more about how it works and how our customers can use it. First off, can you tell us a little about yourself and what you do for Branch?
I’ve been in the mobile industry for nearly seven years. I started at a mobile marketing company that did push and email optimization campaigns using machine learning before I moved to Branch and entered the mobile linking and measurement ecosystem. In both scenarios, my goal has been advancing data science to the forefront of product features to bridge the gap between data complexity and data optimization. At Branch, we’ve done just that with SKAN Magic Set Up, and I regularly work on our other data science systems — most recently in our attribution and fraud protection systems.
Before diving in further, I’d love to hear from you on exactly what the output of SKAN Magic Set Up is. In your own words, would you mind sharing?
The attribution industry is evolving rapidly and the balance between privacy and campaign optimization is increasingly challenging, especially without the right tools. Apple’s SKAN was a catalyst in reshaping our ecosystem, shifting away from user-level tracking to anonymized aggregate metrics.
We recognized an opportunistic gap in the time and resources marketers invest in setting up SKAN campaigns and the need to understand outputs from available inputs. SKAN Magic Set Up solves the complexity of identifying what events should be tracked for a desired outcome. Our goal is to save customers countless hours they would otherwise spend sifting through vast datasets trying to find effective signals. To solve this, Magic Set Up generates a marketing funnel leading to your chosen outcome, providing marketers the most signal differentiation, given SKAN limitations. Simply put, these chosen events are the strongest reference points to indicate where users are in the path to conversion.
All you need to know is your desired final event; from there, we leverage models trained on your data to handle the rest.
Can you give us an example of how it could work?
| TABLE 1a: | |||
| SKAN 1: | INSTALL | _ _available_ _ | PURCHASE |
| SKAN 2: | _ _available_ _ | _ _available_ _ | PURCHASE |
| SKAN 3: | _ _available_ _ | _ _available_ _ | PURCHASE |
Sure, let’s say you’re an e-commerce app, and you want to get the most signal possible from a SKAN campaign tracking toward a user’s in-app purchase. In your existing funnel, you may have 10 important events a user can trigger before making a purchase. You’re probably already tracking these users through these events in your own analytics funnel.
However, SKAN limits the amount of signal you can get from a campaign, so to maximize your signal potential, you’re limited to choosing five events during the available SKAN windows.
| TABLE 1a: | LOW | MEDIUM | HIGH |
| SKAN 1: | INSTALL | _ _available_ _ | PURCHASE |
| SKAN 2: | _ _available_ _ | _ _available_ _ | PURCHASE |
| SKAN 3: | _ _available_ _ | _ _available_ _ | PURCHASE |
When maximizing campaign signal output, Branch recommends you choose a one-to-one correlation between coarse- and fine-grained events to avoid an overdetermined outcome between granularities.
How do you go about choosing the right event schema? From your original 10 events, you have 3.6 million potential outcomes. How do you choose the best events that will help you measure your outcome given SKAN limitations?
Well, that’s where Branch’s SKAN Magic Set Up comes into play. We’ve trained a statistical model on all your users who made a purchase and assigned multiple weights to each event preceding their purchase. These weights ensure the five events we recommend you track are the most likely to be “triggered” by those who purchase, giving you the best indication of campaign success and the progression of users under the limitations introduced by SKAN.
Interesting. So given the limitations of SKAN, we’re outputting a funnel that will maximize the ability to track user progression to a chosen end goal. What information are you using to build this funnel?
That’s correct. We use all the events your app sends via the Branch SDK to reconstruct each user’s event timeline leading up to the final chosen event used in a SKAN campaign.
In short, we use the customer’s app data to build the best funnel — and this is a deceptively complex challenge. In the example above, there are 10 possible events a user can do before making a purchase, and since the order of events matters (e.g., add_to_cart cannot happen before view_item), that creates the 3.6 million possibilities for ordering these events. But since we can only choose five events (with replacement), the problem space becomes smaller at only 2,002 possibilities to track. Don’t let this reduction fool you — because if you don’t know which five events to track, you’re back at the original 3.6 million problem.
So, let’s circle back to the original goal, which is identifying the events most likely completed before a purchase. If we jump into a hypothetical funnel you currently have set up, that includes the events add_payment_method and add_to_cart. Obviously, both events are required before a purchase can be made, so the question becomes what event to choose since we have a limited number of options (i.e., five). One of those weights is the frequency of an event in each user’s journey up to a purchase, as well as how often that event occurred across other similar clusters of users.
The data here is immensely large as we factor in all possible user paths taken during each SKAN time window. Think of it visually as a Sankey chart with diverse and extensive flows across the timeline, some more active than others. Although the problem is far more complex than this analogy, it’s a helpful way to conceptualize the myriad user actions preceding the valuable event. Our goal is to reduce this complexity to a few key events you need to track because, of all possible paths your users take, these events are the most valuable.
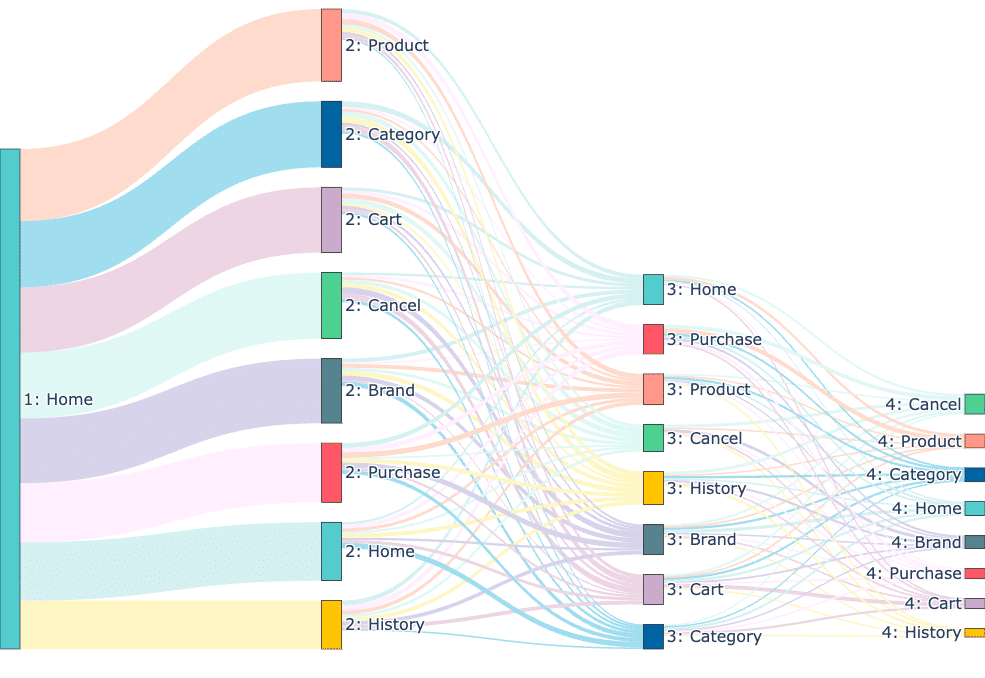
Customer Journey Sankey Diagram Example | Image source
I can imagine it’s pretty sophisticated to generate an output and it’s much too complicated to fully explain in this medium, but can you give our audience a brief summary of how you went about building it?
Apart from the data burden mentioned already, the largest hurdle is how to reduce dimensionality and still provide a strong signal. Briefly, we accomplish this by using multiple data science techniques — user clustering, dimensionality reduction, and statistical weights to determine event importance as it relates to delivering signal. Apart from delivering actionable results, another data science goal was explainability, and that steered us toward the principles used in SKAN Magic Set Up.
Wow, now I understand why we built this for our customers. If you wanted to do this in-house, you’d need a dedicated data scientist like yourself to build something custom. So here’s probably the most interesting question to our customers: How do marketing teams actually go about using the output of SKAN Magic Set Up?
The first step is identifying the event that represents your chosen outcome, which you likely already know. Then, you can start using SKAN Magic Set Up right away. But whether you’re certain about this event or not, I encourage marketers to explore all recommended target events that SKAN Magic Set Up offers, which are essentially the available models Branch trained for each app.
Remember, the goal of the product is to save marketers time and effort in identifying the events that generate the most signal to best help measure performance. So the chosen events should be used as a funnel to track a campaign’s success. Once the SKAN campaign is set up, using this funnel to monitor performance is crucial. For each SKAN window, you’ll want to see the percentage of users progressing from one event to the next. This funnel can be taken a step further if you assign monetary values to each event, which will allow you to calculate the expected lifetime value (LTV) for users in each SKAN window according to their progression towards your final event.
While we put a lot of effort into providing the optimal recommendations for tracking your marketing campaigns’ efficacy, some suggestions may seem more suitable than others. Keep in mind that SKAN Magic Set Up is an unsupervised machine learning solution. Not every recommendation will be perfect for everyone, but it’s designed to maximize your measurement capabilities.
Remember, the suggested events don’t necessarily predict user purchases but instead suggest the most reliable steps to help measure the user path to conversion.
Thank you for the detailed suggestions, Blake. Is there anything you’d recommend for someone that’s getting started or wants to maximize using SKAN Magic Set Up?
We built a powerful data science tool for helping marketers understand campaign performance in a new age of privacy-first measurement. I would offer three suggestions for maximizing the benefits of this tool:
- Our output of recommendations are only as good as the inputs, so I suggest marketers make sure their app is sending the Branch events (both standard and custom) they want SKAN Magic Set Up to consider. On the same front, make sure the custom event names you send are labeled correctly.
- Monitor your campaign performance. This can be done a few ways:
- Calculate the percentage of users flowing through each window to the final event.
- Assign monetary values to each progression for an LTV calculation.
- Use probability calculations, such as conditional or transitional, to determine the movement of users from one event (state) to the next.
- Provide us feedback on SKAN Magic Set Up recommendations and how you’re using it. You’re the expert on your data in both the analytical sense and business sense. Sometimes unsupervised data recommendations will diverge from the logical business application, and that’s where you can help us help you. Our goal is to provide products that make your day-to-day activities easier. Feedback on what’s working and what’s not helps us build better data science products, ultimately giving you more time to focus on other critical business areas.
Have more questions about SKAN or SKAN Magic Set Up? Reach out to us anytime.