
This article was originally published on the TUNE blog. Branch acquired the TUNE Attribution Analytics product in September 2018, and we have republished select pieces of content for the enjoyment of Branch customers. This post was written by John Koetsier, formerly of TUNE.
Widespread reports that the average American adult downloads zero apps per month are wrong. In fact, data from multiple sources — including hard data from 74 million U.S. smartphones and tablets owned by 48 million Americans — indicate that the actual number of app installs is much higher: at least 1.5 apps per person per month.
And that’s just installs that TUNE sees. Which means the actual number is significantly bigger.
BILLION+ CLICK APP CATEGORIES, MEASURED BY TUNE DATA
In late 2014, comScore released its U.S. Mobile App report. Quartz immediately reported that “most smartphone users download zero apps per month.” I tweeted that. I shared that. I used that number in conversations and presentations. I believed it … and so did many others. The narrative continues to this day, fueling news posts with titles like “the app boom is over” and questions such as “have we reached peak app?”
Then, of course, Pokémon Go happened. So much for all the experts.
My first big clue that there was a significant problem with the data came in June 2016 when I ran a survey of 3,005 American smartphone owners. The survey was mostly about why people downloaded some apps and not others, but I did toss in a throwaway question: “How many mobile apps did you install last month?”
The answer was astonishing: 75% of American smartphone owners download at least one app each month. And most install more.
APP INSTALLS PER DEVICE. OF COURSE, MOST AMERICANS HAVE MULTIPLE DEVICES
Not surprisingly, young people install more apps than old people, women install more apps than men, and iOS users install more apps than Android owners. But surprisingly, not one single age bracket — not middle-aged users, not boomers, not senior citizens — said that they installed zero apps per month.
The average number of app installs was always above zero, and the average across the board was 2.3 apps per person per month.
That made me sit up and take notice. But there is a problem with survey data. If you’re a smart analyst, you don’t believe what people say about what they do. You believe hard data that proves what they do.
So we checked hard data.
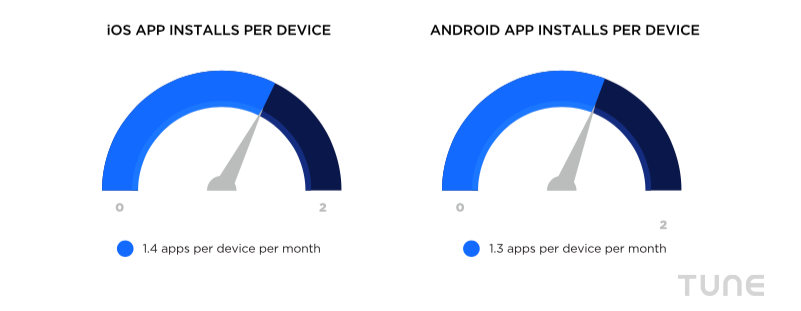
Fortunately, TUNE is significant enough in size to touch 2.2 billion devices globally, which gives us a wide breadth of data from which to analyze the overall mobile market. To cross-reference the survey results, we analyzed an extremely large TUNE dataset that includes a month’s worth of app install data for 74 million smartphones and tablets owned by 48 million Americans.
That told us that installs we see occur at a rate of 1.4 apps per device per person on iOS, and 1.3 apps per device per month on Android. Taking into account that 65% of iPhone owners also own an iPad, and 41% of Android owners also own a tablet, we can calculate that this translates to 2.31 apps per person per month on iOS, and 1.9 apps per person per month on Android.
That actually brings the number into the same neighborhood as the survey data. In all honesty, this was surprising to see.
All that said, there are obvious biases inherent in this methodology. Our hard data is a self-selected group: people who don’t download apps won’t ever fit into it.
However, since we know the number of smartphone owners in the country, and we know the distribution between iOS and Android platforms, we can make a few simple calculations that will provide valid data on app install behavior across the board. For example, what if every single smartphone owner that is invisible to TUNE technology downloads exactly zero apps per month? Or one every three months … an effective rate of 0.3 installs per month? Or two … which, of course, is 0.5 installs per month.
The result:
Even if every iOS user we don’t see never downloads a single app, average iOS install volume is 0.68 apps per device per month, and 1.2 apps per person per month. Similarly, for Android, the equivalent numbers would be 0.46 apps per device per month, and 0.65 apps per person per month. If you take a much more reasonable guesstimate that smartphone owners we don’t see install just one app every other month, then the average apps per person per month figure jumps to a little over 1.5.
And that doesn’t factor in the reality that TUNE doesn’t see all the apps mobile users install. If someone goes to Google Play and installs an app that doesn’t include our technology, we don’t see it. So clearly, there are plenty of installs that we’re missing.
Survey data is interesting, and hard data is more definitive, but I always also want to check what other smart and influential organizations are saying. Everyone has access to different data sources, and by pooling resources we can get a closer view of reality.

There are multiple estimates of the number of app downloads for the last full year for which we have complete data, 2015:
- Business of Apps: 25 billion iOS, 50 billion Android
- App Annie: 111.2 billion total, including third-party app stores in China etc.
- Forrester: 226 billion total (mid-year estimate)
Divide those numbers by the number of devices we know from Apple’s and Google’s public statement to be in use, and we can calculate installs per device. Pretty clearly, Business of Apps, at 31, is the closest to comScore’s zero apps per month.
But it’s still at 2.5 installs per device, which means perhaps three or more per person. App Annie is at 46 installs per device, and Forrester’s mid-year projection was 94 apps per device, which would equal almost 12 per person per month, at our standard 1.6 multiplier from devices to people.
(Again, that’s based on published data on dual ownership of smartphones and tablets.)
The big caveat here, of course, is that these numbers are global and include significantly growing mobile ecosystems, such as China, India, and Africa. However, even if you wipe out half of the numbers off the top, the lowest total still works out to more than one app per month. And assuming that the U.S. is only 25% of the app install velocity of the rest of the world still puts American smartphone owners at an average of one app install per device per month, using App Annie’s numbers … which is 1.6 app installs per person per month.
No matter which numbers you choose, Americans are downloading more apps than previously reported. So much so that 1.5 per month seems a reasonable, evidence-supported, and very conservative number.
Very likely, the true number is right where the survey said it was: 2-3 per month.