

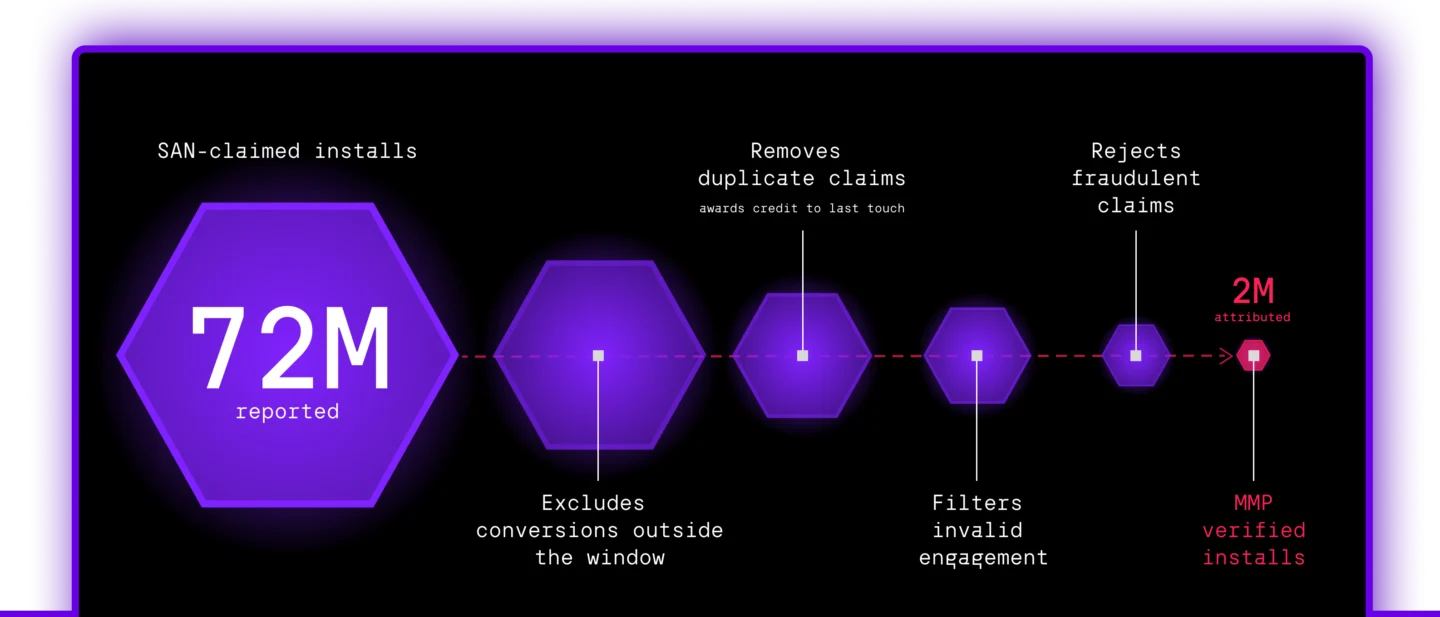
72 million vs. 2 million. Same campaign, same week.
That’s a real gap I saw between what an ad network reported and what a customer saw within the Branch platform. They were understandably concerned that something was badly broken.
It wasn’t. If those two numbers had matched, that would be the anomaly. Ad networks and mobile measurement partners (MMPs) like Branch count with different rulebooks, so they’ll never agree and they really aren’t supposed to. You just need to know which number to trust for your particular scenario or decision.
Let’s break down why the gap exists, and how to read it.
Self-attributing networks grade their own homework
Meta, Google, Apple Search Ads, TikTok, and Snap are what the industry calls self-attributing networks (SANs). Each one decides, on its own terms, what counts as a conversion, how long it will claim credit after a click, and how it slices the data by geography and time. Then it hands you a number that reflects its rules and its interests.
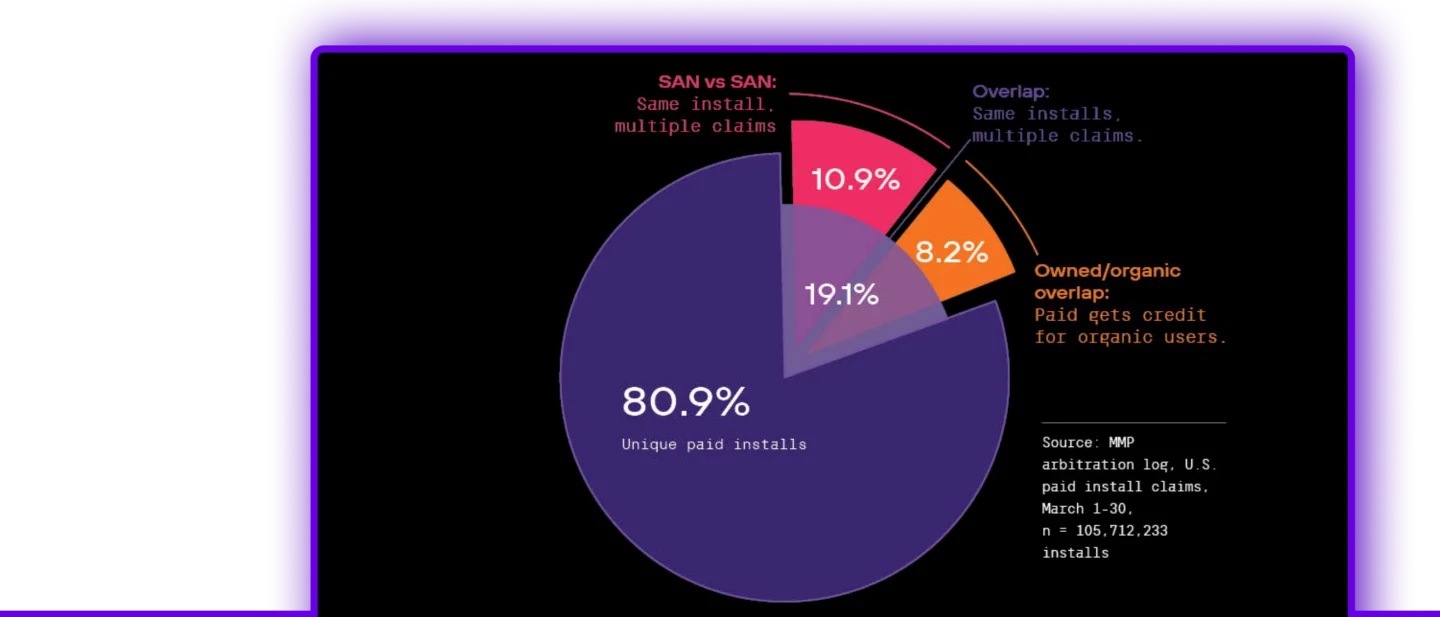
That creates a problem when marketers can’t reconcile the ad networks’ self-reported numbers. Branch recently analyzed over $105 million in paid ad spend in the U.S. and found that networks had counted and billed nearly 20% of installs twice. More than 10% of that double-counting came from SANs.
The whole MMP category arose to address this problem. In the early days of app install advertising, marketers had no independent way to check on ad networks’ claims against another’s, and every network was incentivized to claim as many installs as they could get away with.
Branch does something fundamentally different from the ad networks. It applies one consistent set of rules across every network at once, deduplicates the overlap, and gives credit to the true last touch.
The six reasons your numbers diverge
- Attribution windows. This is the big one. If a network counts a conversion up to seven days after a click, but you’ve set your attribution window to one day, the network will report far more conversions than your MMP because most of them fall outside the window you chose. Attribution window discrepancies account for a large portion of that 72-versus-2-million gap we saw with a large streaming company. The brand had set a one-day attribution window within Branch, and the overwhelming majority of the network’s claimed conversions landed outside of that.
- Self-attribution vs. last touch. Every network claims credit whenever possible. Branch awards the win once, to the last touch, and shows which channels assisted on the journey to that conversion. Deduplication is why the number is almost always lower and more trustworthy for comparison.
- Campaign allowlisting. Some clicks and impressions never should have counted as a touchpoint at all, whether they’re from bots or accidental taps. To keep your analytics honest, Branch removes that noise from your reporting. Campaigns that drive no installs, reinstalls, or opens automatically get filtered out. If clicks or impressions look “missing” for a campaign, this is often why.
- Fraud rejection. When a self-attributing network’s (SAN) claimed conversion shows signs of fraud, like an install that lands faster than a real person could actually tap through and install an app, Branch catches that, rejects the claim, and hands credit to the next valid touchpoint. Your SAN reporting will still show that claimed conversion.
- Currency conversion. Networks report in local currency; Branch normalizes everything to a single currency like USD using live exchange rates. That typically creates small, steady cost differences.
- Data freshness. Mobile measurement partners (MMPs) pull network data on a delay, and an occasional failed pull needs a backfill. Sometimes your numbers can look low, then will self-correct within a day or two.
Which number should you actually trust?
The answer depends entirely on the question you’re asking.
- “How much did I spend?” Your ad network is the source of truth for its own billing, so it will have reliable spend data. Your MMP will be more useful for aggregating that cost data across channels — whether through direct integrations or report uploads — and tying it to revenue insights.
- “Which channel actually drove the install?” Trust your MMP. It’s the only system deduplicating across every network and making a neutral, consistent call on which touchpoint actually earned the credit.
- “Is Channel A outperforming Channel B?” Trust your MMP. Branch manages and applies the relevant attribution logic you’ve set across apps and partners, and provides full visibility into the journey and channel influence that led to a conversion. SANs only have visibility into their own traffic and events.
- “Did this one campaign convert?” Cross-check your MMP and SAN data, but reconcile your window and attribution settings first. Your MMP is likely going to be more useful, and accurate, for tying downstream conversions to specific channels and campaigns.
A lower number reported by your MMP doesn’t necessarily indicate weaker performance. It’s a deduplicated, consistent one that you can trust as the foundation for spending decisions.
Ask yourself these questions (before you panic!)
Most “discrepancy emergencies” resolve with five questions:
- Do the attribution windows match on both sides?
- Is the campaign actually driving app opens or installs?
- Are you comparing the same date range and time zone?
- Are you looking at the same geographic granularity?
- Has the data fully finished ingesting?
Branch makes reconciliation less painful
Chasing these differences by hand is tedious, and it pulls marketers away from the work that actually moves numbers.
Branch has built transparency and discrepancy reporting into its platform that surfaces network-reported performance and arbitration data that shows which networks won or lost claims and why. Instead of guessing whether a difference is expected, you can see it labeled and move on with confidence.
Discrepancies will never (and should never) fully disappear. Once you can read them, they stop being a source of anxiety and start being a sign that your measurement is actually doing its job.