What is click flooding?
Click flooding is a form of mobile ad fraud in which attackers deploy automated scripts that flood digital ads with an overwhelming number of fake clicks to skew accurate ad performance measurement. These assaults waste resources, diminish the return on investment, and erode trust in digital marketing metrics.
Click flooding typically happens when a bot cycles through as many device IDs as possible and fires off clicks from every single ID repeatedly. Fraudsters may set the goal to generate 20B clicks over the span of one week.
Within this one week window, if any of the devices happen to have any organic app install events, these randomly generated clicks claim the credit. This is an example of click fraud. Alternatively, users may have installs triggered by real clicks on ads. Fraudsters may hit the jackpot if their fake clicks happen to follow the real click and precede the completed installation of a mobile app, thereby claiming the last-touch grand prize. This is an example of attribution fraud.
How to detect click flooding
For the same number of installs, you will see a lot more clicks. The first thing you want to check is the click-to-install rate. If any ad network or publisher has an exceedingly low click-to-install rate or much higher number of clicks for each install, that is red flag. Every campaign could be different — make sure you look at trends over time and compare across publishers and networks. A click-to-install rate that is way below the historical trend line or way below peers’ for the same campaign would indicate a high chance of fraud.
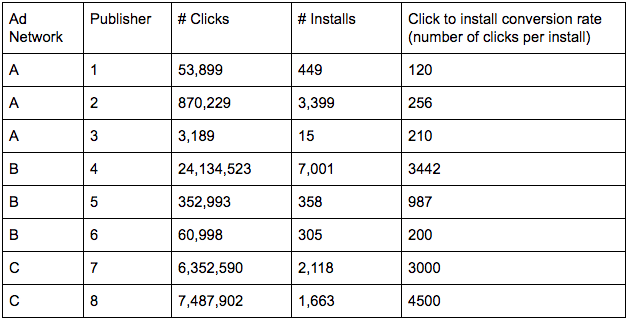
Below is a simplified illustration of cross-network-cross-publisher comparison. You can probably see that publisher 4 has a much higher number of clicks per install compared to others in the same network. Similarly, network C seems to be an outlier compared to A and B, raising red flags. It does not necessarily mean that publisher 4 and network C should automatically be blocked. As a marketer, it is prime time to take the click-to-install rate data provided by your attribution partners like Branch to network B and C to understand what drives the outlier. If we see persistently high clicks per install with a particular network or publisher across the board, we may also add them to our blocked list, blocking click attribution in real time.
Recently, we have seen fraudsters restricting their click flooding to a smaller volume to fly under the radar. In other words, click-to-install conversion rates will probably not look completely out of whack. This is where combining click to install rate tracking with click-to-install time (CTIT) distribution analysis would be important.
Click-to-install time (CTIT) or time to install (TTI) distribution
Click to install time (CTIT) is essentially a type of distribution modeling that analyzes the lag time between a click and the associated install event.
Here is the typical flow: a user clicks on an install ad, gets redirected to the appropriate app store, downloads the app, and installs the app. Multiple factors influence the time lag between click and install — among them, the nature of the app, speed of internet, size of the app, potential loss of internet signals during the download process, urgency to use the app, and distraction from other apps. This lag varies by specific user and by specific mobile app.
On average, click-to-install time is normally distributed. The app average depends on the size and type of the app; deviation is expected. It is likely to be skewed, as most users will likely install soon after clicking on an install ads.
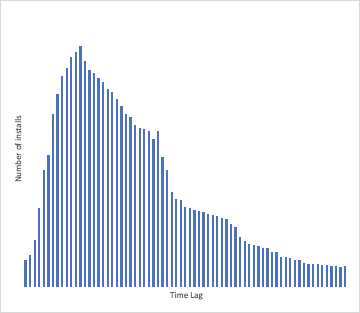
A worrying sign of click flooding is when you have relatively uniform distribution of installs over time, with a high density in the long click-to-install time region. If fraudsters are firing clicks in the dark, there is almost equal chance of having the click hit the device five seconds, two hours, or two days before the completely independent mobile app install event.
Please note that the same publisher or network may have a mix of legitimate click induced installs and organic installs stolen by fraudulent clicks. Therefore, the CTIT distribution you would receive is often somewhere in between. As mentioned above, temporal comparisons and horizontal comparisons are important in establishing the norm for your app and for a similar paid campaign. You are not necessarily looking for complete uniform distribution of CTIT, but rather for significant deviations from the norm.