

Key takeaways
- Branch found five structural inefficiencies consistently across more than 105 million paid install claims and $90 million in ad spend analyzed.
- On a $10 million UA budget, three of the five mobile attribution gaps have clear, calculable costs that add up to $4.5 million in recoverable value.
- 19.1% of paid install claims are counted by multiple sources, a $1.9 million hit on a $10 million budget.
- Last-touch misattribution costs a conservative $540,000 on a $10 million budget; moving to multi-touch attribution delivers a 3% ROAS lift without additional spend.
- Front-loading creative spend into the lowest-efficiency window costs $1.12 million on a $10 million budget.
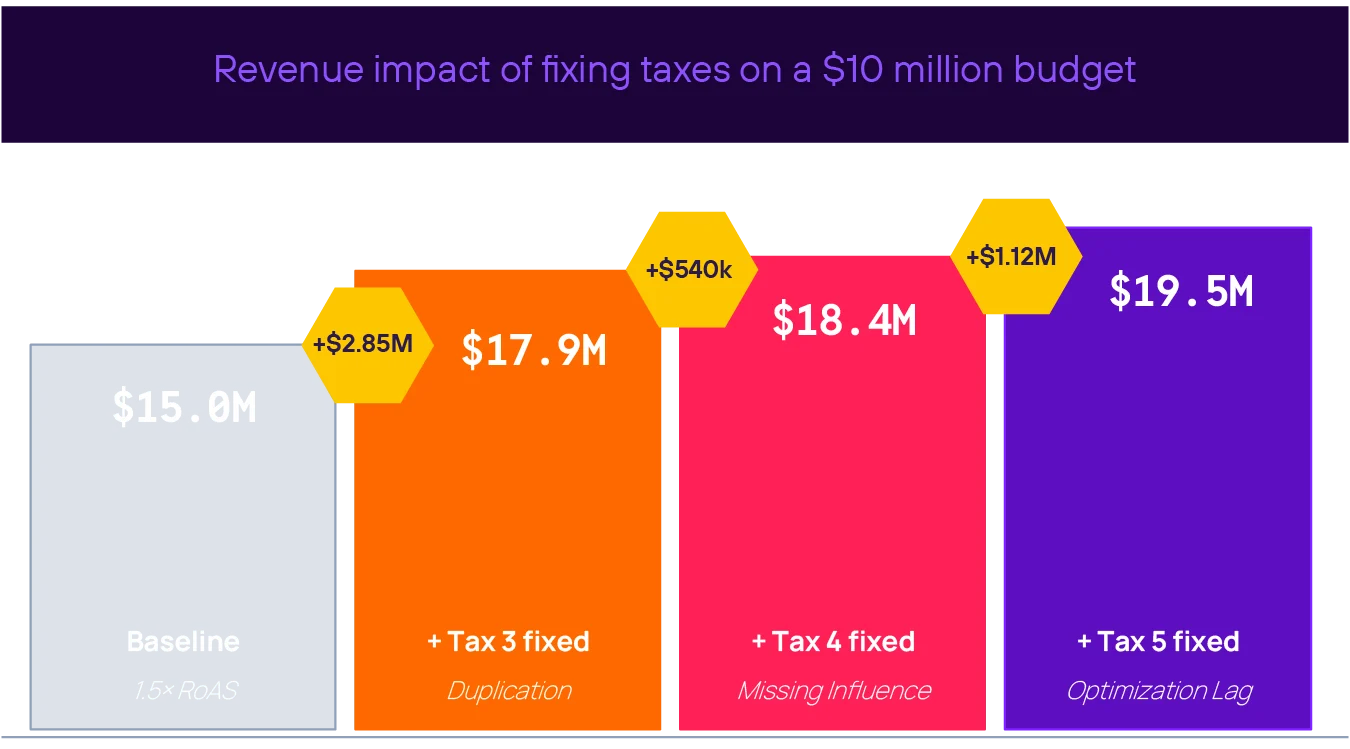
- Fixing all three moves ROAS from 1.5x to just under 2x on the same budget.
You probably already know your mobile attribution has gaps. Here’s what those gaps are costing, in numbers you can bring to a budget conversation.
Branch analyzed more than 105 million paid install claims and $90 million in ad spend and found the same five inefficiencies consistently across the programs it measured. They’re structural, not situational, and they compound. On a $10 million UA budget, they add up to $4.5 million in spend that’s already allocated and returning less than it should.
Below, we break down three of the five and show you how to build the internal case for fixing them. Download the full report for all five, in the order they should be addressed, with complete data and fixes for each.
Duplicated install claims: $2.85M
Almost one in five paid install claims is being counted twice. Of 105 million U.S. paid installs analyzed, Branch found 19.1% had been claimed by multiple sources.
Some of that is SAN-vs.-SAN overlap: Google, Meta, TikTok, and Apple Search Ads each run their own attribution model, each claims the install, and each bills for it. There’s no neutral referee across platforms. Some of it is owned-channel overlap, where email or CRM activity contributed to an install but paid took full credit because those touchpoints never entered the attribution layer.
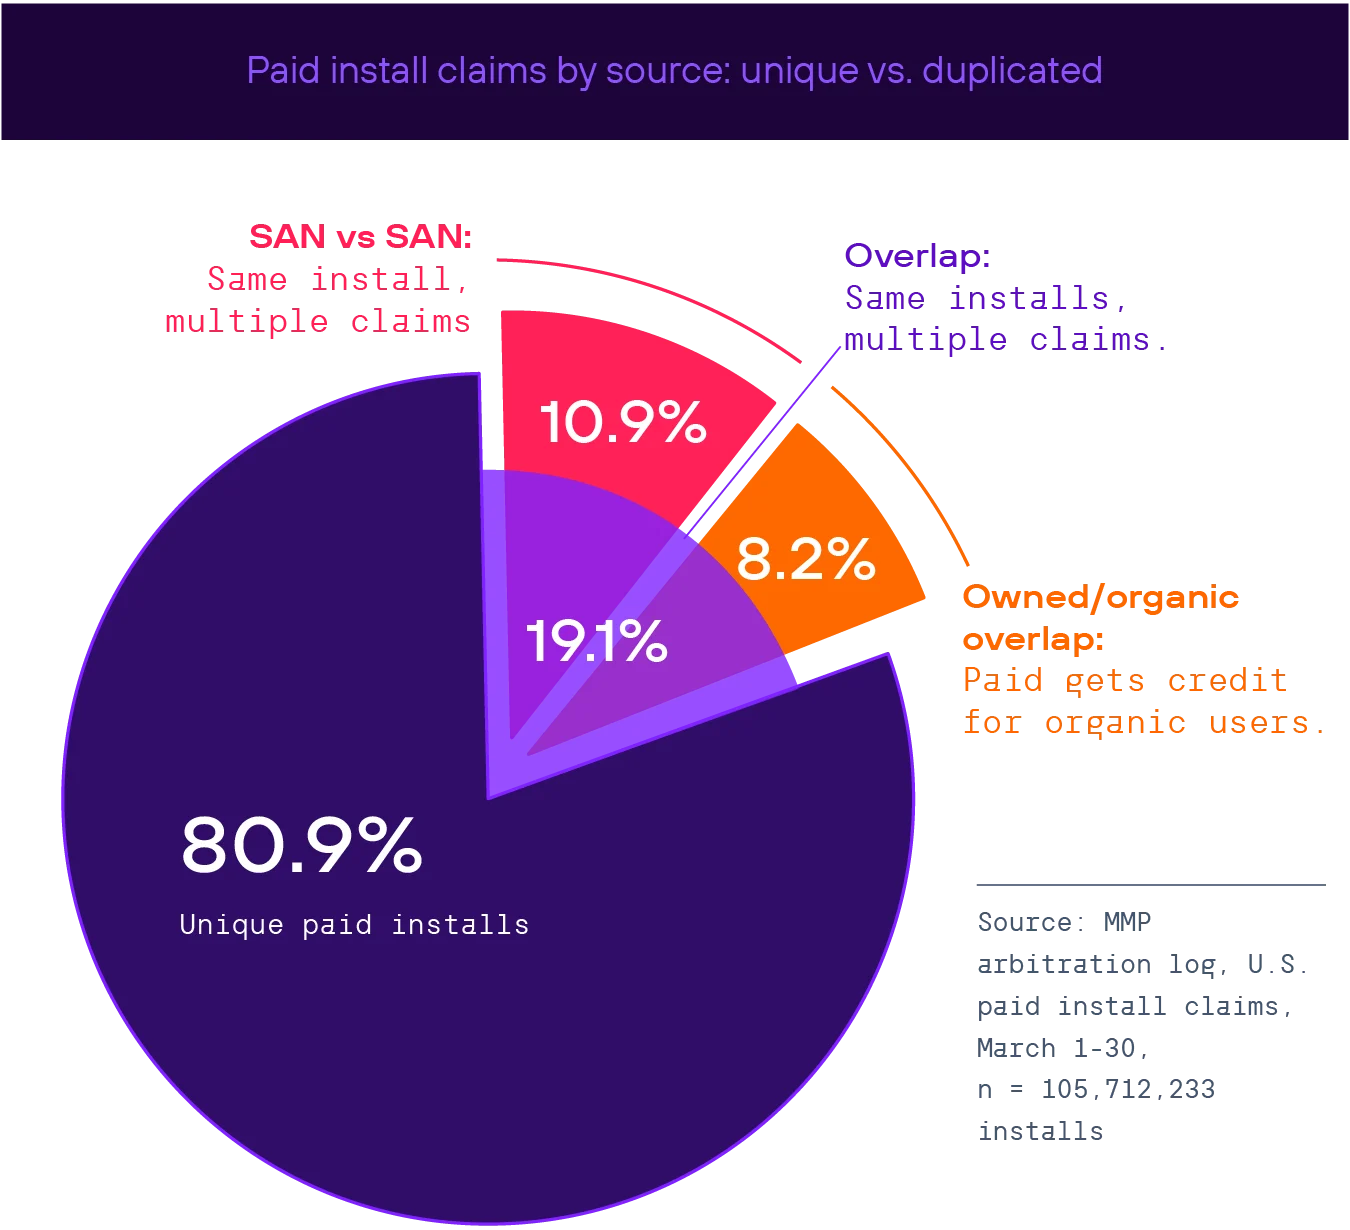
On a $10 million budget, 19.1% duplication is a $1.9 million hit that doesn’t appear anywhere as a line item.
Misattribution: $540K
Last-touch attribution is the industry standard for mobile install measurement, and for most installs it works. But Branch data from 4.6 million installs shows 5.85% are either miscredited or over-credited when mapped against the full touchpoint path rather than just the final click.
A common scenario: a paid ad generates intent, but the user doesn’t install right away. A week later they search for the app and install through an organic result. Last-touch credits organic. The paid channel that started the journey gets nothing, and budget flows away from it.
Moving from last-touch to multitouch attribution — a model that distributes credit across all touchpoints in the user journey, not just the last one — delivers a conservative 3% return on ad spend (ROAS) lift, $540,000 on a $10 million budget, without additional spend.
Misallocated spend: $1.12M
Most UA budgets front-load spend, with the heaviest concentration in the first days of a campaign, on the assumption that creative performance peaks at launch and declines from there. Branch data from $91.9 million in U.S. paid spend tells a different story.
Click-through rates (CTRs) rise as creative ages, reaching its highest point in the day 28+ window, the same window where almost no budget remains. Of that spend, 31.5% was concentrated in the lowest-efficiency window. Ad platforms spend the early days of a campaign in a learning phase, identifying which audiences respond to which ads. By the time that process matures and CTR peaks, most budgets are nearly exhausted.
Optimizing budget timing across creative age windows could recover $1.12 million on a $10 million budget.
Why the order matters
These three taxes don’t operate independently. Each one distorts the data the next decision gets made from. Duplicated claims inflate paid’s apparent performance, which makes misattribution harder to see because the numbers look reasonable even when credit is going to the wrong channels. And if spend is being front-loaded into low-efficiency windows based on inflated ROAS figures, the optimization lag compounds on top of a number that was already wrong.
That’s why the full report sequences the fixes deliberately. Cleaning up duplication first gives you a more accurate baseline. Accurate attribution on top of that gives you a cleaner picture of which channels are actually driving results. Spend optimization on top of that means you’re reallocating based on something real.
How to make the attribution business case to leadership
The good news is that none of these fixes require additional spend. Your budget is already allocated; now the work is in measurement infrastructure and getting the numbers right.
On a $10 million budget, fixing all three mobile attribution gaps moves ROAS from 1.5x to just under 2x. The underlying rates are consistent across programs, so you can apply the same percentages to your own budget for a directional read on your exposure.
Attribution tends to get treated as a technology problem in these conversations. The data here makes it a financial one: Measurement determines allocation, and when allocation is off, the return reflects it.
The most concrete place to start is the gap between what your SANs are reporting and what your mobile measurement partner (MMP) is arbitrating. That number is specific to your program, requires no new spend to surface, and gives you something real to put in front of a CMO or CFO.
The remaining two taxes and the complete fixes for all five are in the full report.