
App marketers are under increasing pressure to prove return on investment (ROI) as the privacy landscape continues to shift. iOS 14.5+ introduced App Tracking Transparency (ATT), requiring users to opt in before apps can access the identifier for advertisers (IDFA) — and significantly reducing the deterministic attribution data most teams had built their measurement around. This has resulted in real gaps in visibility: Campaigns that were once straightforward to evaluate now require more sophisticated approaches to measurement.
Mobile advertising analytics have become the essential foundation for filling those gaps, giving teams the data-driven basis they need to optimize campaigns, justify ad spend, and drive sustainable growth.
Why are mobile advertising analytics important?
Mobile advertising analytics refers to the measurement and analysis of user interactions across mobile ad campaigns, from the initial touchpoint through in-app conversions and long-term value generation. They connect advertising spend to actual business outcomes, giving you a clear picture of which campaigns generate users who convert, engage, and drive revenue.
In the mobile advertising market, valued at $262.84 billion in 2025 and projected to reach $1.27 trillion by 2034, shrinking deterministic signal has made probabilistic modeling and aggregated measurement essential complements to traditional attribution. Having the right analytics infrastructure is what makes accurate attribution, budget optimization, and stakeholder reporting possible.
Essential mobile advertising analytics metrics to track
Tracking the right metrics ensures your campaigns drive measurable ROI, so focus on metrics that remain actionable despite privacy restrictions.
User acquisition and attribution metrics
Mobile advertising attribution has grown more complex with iOS 14.5+, limiting IDFA availability, but the core metrics remain essential for evaluating channel efficiency and install quality.
Key acquisition and attribution metrics to track include:
- Cost per install (CPI): Total ad spend divided by attributed installs. Useful for evaluating channel efficiency, but only meaningful alongside downstream metrics. A low CPI that produces users who never convert isn’t a win.
- Install-to-registration rate: The percentage of new installs that complete onboarding. A low rate often signals a mismatch between what your ad promised and what the app delivers.
- Click-to-install time: The duration between ad click and app install, revealing friction points in your conversion funnel. Unusually short times can indicate install hijacking or click injection fraud; unusually long times suggest click flooding.
- Multi-touch attribution data: User journey insights showing all touchpoints before install, so you understand how channels work together rather than over-crediting the last click.
These metrics work best read together. A campaign with a low CPI but poor install-to-registration rate may be driving cheap but low-quality users. Analyzing these mobile analytics metrics together helps you identify your most efficient growth levers.
Engagement and retention metrics
Acquiring users is only half the equation. Engagement and retention metrics like these reveal whether those users find lasting value in your app or churn before delivering meaningful ROI:
- Day 1, day 7, and day 30 retention rates: The percentage of users who return at each interval. Day 1 reflects onboarding quality; Day 30 reflects whether users have built a habit around your app.
- Session frequency and duration: How often users open your app and how long they stay. Declining session depth across a cohort often signals that ad creative is attracting the wrong audience.
- Feature adoption rates: Which in-app features acquired users actually engage with. A gap between what your ads highlight and what users do in-app is a signal to realign creative.
- Churn rate by acquisition source: When users stop engaging, broken down by channel. This is one of the most underused metrics in mobile advertising. It tells you which channels are producing genuinely valuable users versus which channels are producing users who look good on install reports.
A campaign that drives 10K installs with 15% day 7 retention delivers far less value than one generating 5K installs with 45% day 7 retention. Connecting engagement data back to specific campaigns and audience segments lets you shift budget toward sources that drive more long-term users.
Revenue and ROI tracking metrics
Revenue tracking translates ad spend into direct business outcomes, moving your focus beyond install counts to the actual monetary value users generate. In practice, this could mean tracking purchases and average order values for e-commerce apps, trial-to-paid conversion rates for subscription services, and in-app purchase frequency for gaming apps. Here are some key metrics to consider:
- Return on advertising spend (ROAS): Revenue generated divided by advertising costs. The most direct measure of campaign efficiency, but only reliable if your attribution is accurately connecting ad spend to downstream purchases.
- Customer lifetime value (LTV): The total revenue a user generates over their relationship with your app. Segmenting LTV by acquisition source reveals which channels bring users who spend, not just users who install.
- LTV to customer acquisition cost (CAC) ratio: Compares user value against acquisition cost. A ratio below 3:1 is generally a signal that acquisition costs are outpacing the revenue users generate.
- Time to first purchase: How quickly new users convert to paying customers. Short times suggest strong intent alignment between your ad and your app. Long times can indicate friction in the conversion flow or a mismatch between audience and offer.
Privacy restrictions have made granular revenue attribution harder, particularly on iOS, where SKAdNetwork (SKAN) limits the conversion value data available per campaign. This is where attribution platforms that use predictive modeling and aggregated measurement fill the gap, giving you revenue signal even when user-level data isn’t available.
Top mobile advertising analytics platforms and tools
The right mobile advertising analytics platform for your business should deliver accurate channel-level attribution, integrate with your existing tech stack, and provide actionable insights that drive optimization.
There are plenty of solutions that track metrics, yet different platforms can serve distinct roles. For example:
- Google Analytics 4 (GA4) works well for businesses already invested in the Google ecosystem, offering automatic event tracking via Firebase, cross-platform user reporting, and predictive metrics like purchase probability and churn risk.
- Meta’s native tools are essential when Facebook and Instagram are your core acquisition channels, though they work best as part of a broader measurement framework.
- Mobile attribution platforms like Branch go beyond basic tracking to deliver comprehensive user journey insights and a unified view that helps you optimize the entire funnel.
Google Analytics for mobile apps
GA4 tracks user behavior across iOS and Android via the Firebase software development kit (SDK), which instruments the app and feeds events directly into GA4 for reporting. It’s a natural fit for teams already invested in the Google ecosystem, particularly those running paid acquisition through Google Ads.
Key strengths:
- Automatic event tracking: The Firebase SDK captures core app usage data out of the box — including app opens, in-app purchases, and active user counts — without additional code.
- Cross-platform reporting: The User-ID feature stitches mobile and web behavior into a single user view, which is valuable for teams that have users who move between surfaces before converting.
- Predictive metrics: Machine learning forecasts purchase probability and churn risk, enabling proactive targeting of high-value users.
However, GA4 requires manual setup for events beyond what Firebase tracks automatically, creating engineering overhead that can delay implementation. Its attribution is also primarily Google-ecosystem-focused. Teams running campaigns across multiple ad networks typically need a dedicated mobile measurement partner (MMP) alongside it. Predictive features also have minimum data volume requirements that may limit functionality for earlier-stage or lower-traffic apps.
Meta Business Suite and Ads Manager
Meta Business Suite and Ads Manager consolidate analytics for Facebook and Instagram campaigns into a unified dashboard, giving app marketers real-time visibility into reach, engagement, and paid performance across both platforms.
Key strengths:
- Unified cross-platform reporting: Meta Business Suite aggregates reach, engagement, and audience demographics across Facebook and Instagram for consolidated reporting.
- Custom Ads Manager reports: You can build tailored reports with key performance indicators (KPIs) like click-through rate (CTR), cost per action (CPA), and ROAS, then schedule automated delivery to stakeholders.
- Advantage+ AI optimization: Machine learning automates bidding, budget allocation, and creative delivery based on campaign objectives.
As a self-attributing network (SAN), Meta reports its own conversions, which frequently overlap with other channels and can inflate performance numbers when you try to reconcile across your full acquisition mix. A dedicated MMP is necessary for a neutral cross-channel view. iOS signal loss post-ATT has also reduced the accuracy of Meta’s reported performance for app campaigns, making third-party attribution increasingly important.
Branch and mobile attribution platforms
MMPs are the dedicated layer that connects ad spend to downstream app behavior. Unlike GA4 or Meta’s native tools, MMPs provide neutral, cross-channel attribution that isn’t tied to any single ad network’s reporting. Branch is one of the leading MMPs, purpose-built for the post-IDFA era and trusted by over 100,000 brands across retail, finance, and travel.
Key strengths:
- Cross-platform attribution with cost aggregation: Branch consolidates performance data from 80+ advertising platforms including Google, Meta, TikTok, Snapchat, and Apple Search Ads into a single dashboard, so you’re comparing channels on equal footing rather than reconciling platform-reported numbers.
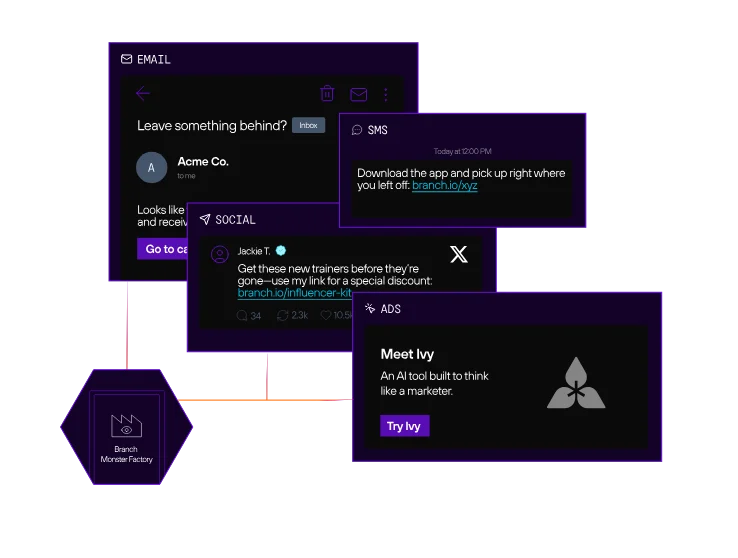
- Paid and organic measurement in one view: Unlike tools built purely for paid campaign tracking, Branch attributes conversions across organic sources like search engine optimization (SEO), email, social, referrals, and QR codes alongside paid channels. That unified view lets you understand your full acquisition mix and avoid overinvesting in paid when organic channels are doing meaningful work.
- Predictive Aggregated Measurement (PAM): Branch’s PAM solution expands attribution coverage for opted-out iOS users by applying predictive modeling to traffic previously marked as unattributed or reported under SKAN, without compromising user privacy.
- Deep linking foundation: Deep linking ensures the user journey your analytics are measuring is actually working as intended. Poor routing (when users land on a generic home screen instead of the content they clicked on) creates drop-off that looks like poor campaign performance when it’s really an infrastructure problem. Branch’s deep linking handles routing across install status, device, and platform so your analytics reflect real campaign effectiveness, not friction you introduced.
Branch integrates with tools like Braze and Amplitude, provides HIPAA-eligible data protection for regulated verticals, and works within your existing tech stack without requiring you to rebuild your measurement infrastructure. For app marketers who need to connect ad spend to real outcomes, Branch Engagement and Performance deliver the attribution accuracy and cross-channel visibility required to scale high-performing campaigns.
How to set up mobile advertising analytics tracking
Setting up mobile advertising analytics starts with choosing an MMP. An MMP is the central hub that connects your app to your ad networks, attributes installs and in-app events to the campaigns that drove them, and gives you a consistent methodology across every channel. Without one, you’re relying on self-reported data from each platform, which means overlapping attribution, inflated numbers, and no reliable way to compare performance across channels.
Once your MMP is in place, the setup breaks down into two areas: mobile SDK implementation and campaign configuration.
Implementing attribution SDKs and tracking tools
Accurate mobile advertising analytics start with proper SDK implementation. Attribution SDKs integrate directly into your iOS and Android apps, capturing user interactions from the first ad impression through the entire in-app journey. To make the most of them, however, you’ll need to implement a few key practices:
- Privacy-compliant data practices: Your SDK needs to work within iOS ATT requirements, using probabilistic modeling and aggregated measurement to maintain attribution coverage for users who don’t opt in.
- Cross-platform consistency: Users arrive from web, iOS, Android, and increasingly connected TV. Gaps in SDK coverage across any of these surfaces create blind spots that distort your channel performance data. Branch provides SDKs for both web and mobile platforms, so deep linking, attribution, and engagement tracking can be instrumented consistently across every surface from a single integration.
- Deep linking integration: Pairing attribution SDKs with deep linking technology routes users from ads into specific app content, enabling measurement of true campaign effectiveness beyond simple install counts.
SDK implementation requires coordination between marketing and engineering: Engineers integrate the SDK into the app codebase, while marketers define which events to track and how to structure campaign parameters. Getting alignment on event taxonomy early saves significant cleanup work later.
Configuring campaign parameters and conversion events
Once your SDK is integrated, your ability to calculate ROI hinges on how you configure campaign parameters and conversion events. Establish a disciplined naming convention for all parameters, including source, medium, campaign name, and creative identifiers. This consistency enables you to accurately segment performance data and compare the effectiveness of different channels, ad sets, or creative variations.
For conversion events, prioritize quality over quantity by tracking high-impact actions that map directly to business outcomes, like registration completions, purchase events with revenue data, or subscription activations. Check out this guide to mobile app event tracking for industry-specific event recommendations.
How to optimize mobile ad campaigns using analytics data
With your measurement foundation in place, the work shifts from setup to continuous improvement. The most effective optimization programs run on three engines: structured testing, performance-driven budget decisions, and AI-powered insight.
A/B testing creative and targeting strategies
A/B testing turns mobile advertising analytics from a passive reporting tool into an active optimization engine. By systematically testing variations of ad creative, messaging, and audience segments, you discover which combinations deliver the highest conversion rates at the lowest cost per acquisition.
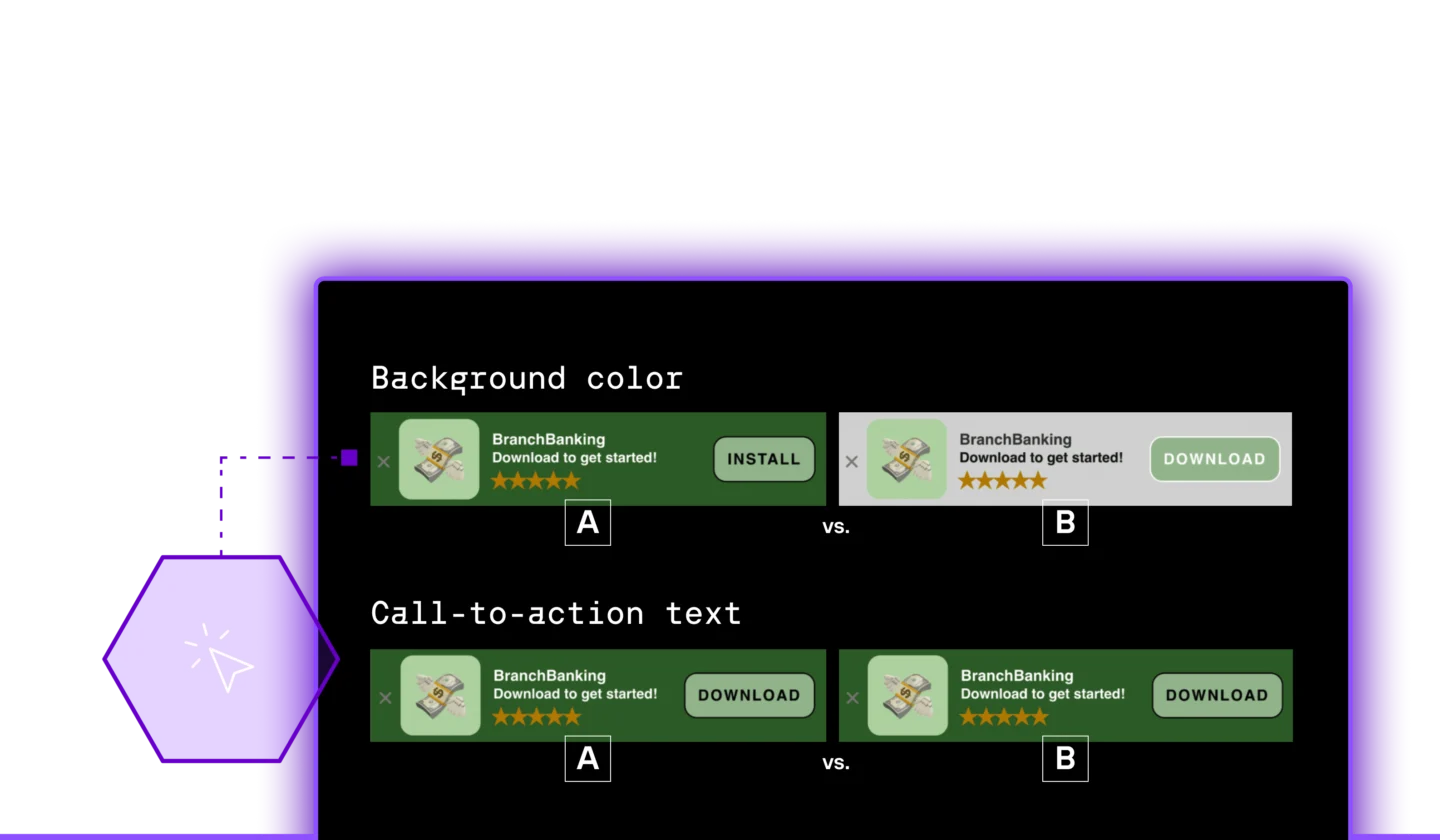
The most effective testing strategies isolate a single variable to ensure clear, actionable results. Key elements to test include:
- Ad creative (e.g., visual styles, user-generated content)
- Messaging (e.g., value propositions, headlines)
- Calls to action
- Audience segments
- Ad placements
A disciplined A/B testing program builds institutional knowledge about what works for your app and audience. Not sure where to start? Check out these six A/B tests every app growth team should run.
Documenting your findings creates a strategic playbook that informs future campaigns and reduces the learning curve for new channels or product launches. This iterative approach to mobile in-app ad optimization ensures campaigns continuously improve, preventing performance from plateauing after the initial setup.
Setting up budget allocation based on performance data
Performance data transforms mobile advertising analytics from a reporting exercise into a strategic advantage. The most effective budget allocation decisions start with a clear view of which channels are actually driving revenue — not just driving installs. This means tracking CPA to understand what you’re paying for each meaningful conversion, ROAS to confirm campaigns are generating more than they cost, and LTV to ensure the users you’re acquiring are worth the price of acquisition over time.
To do this, follow three steps:
- Establish clear performance thresholds for each channel. Set minimum ROAS targets and be ready to pause or reduce spend on any campaign that falls short. A unified analytics platform is essential here. It consolidates cost and conversion data from all networks, helping you spot when one channel is saturated while another has untapped potential.
- Allocate a test-and-learn budget to explore new channels, audiences, or creative approaches. When a test campaign exceeds your performance benchmarks, scale its funding and graduate it into your core strategy.
- Revisit your budget allocation on a regular cadence so spend reflects current performance rather than assumptions made last quarter.
Using AI to surface insights and act faster
Even well-staffed teams hit a ceiling on manual analysis. Processing attribution data across 80+ channels, spotting emerging patterns before they become expensive, and benchmarking performance against industry peers — doing all of that in real time isn’t a bandwidth problem you can hire your way out of. It’s a tooling problem.
That’s where AI earns its place in the optimization workflow. Ivy, Branch’s integrated AI, unifies all your data sources into a single searchable workspace and surfaces personalized, actionable recommendations from the moment you log in. Rather than digging for insights, you act on them.
Ivy also powers features like Industry Benchmarks, verticalized competitive context to compare your app’s performance against real industry peers. Knowing your paid vs. organic install ratio is useful. Knowing it’s significantly above your vertical’s median is the signal that tells you how you should adjust.
That’s the real value of mobile advertising analytics done right: not just more data, but faster, more confident decisions about where to spend, what to scale, and what to cut.
Want to learn more? Reach out to a Branch expert.