


Tying every marketing dollar to measurable outcomes across the full customer journey requires clear visibility from click to conversion to revenue. For marketers that rely on manual spreadsheet-based processes, return on ad spend (ROAS) analysis eats up hours. For those with more sophisticated tools, visibility is often cloudy and outputs can be unreliable.
In both cases, data fragmentation is the real problem. Manually compiling information from disconnected systems is tedious and often leaves you with duplicated records, incomplete data, or inaccurate attributions. Pulling that same disparate data into a modern analytics system just produces untrustworthy results faster.
Can AI simplify marketing data analysis?
Yes, AI data analysis streamlines how marketers make sense of their data by speeding up querying and pattern finding. The catch is that AI tools only work well against data that’s been cleaned, reconciled, and deduplicated. Feed AI a fragmented picture, and it will confidently return wrong insights.
Mobile data cleaning is difficult, regardless of tool
Marketers trying to understand mobile ROAS run into several issues when tracking user journeys across platforms and devices:
- Self-attributing networks (SANs), which attribute traffic and conversions on their own, have visibility only into their platform. Because they can’t see the user’s interactions with marketing across other platforms, SAN dashboards show higher conversion counts than a third-party attribution provider would.
- Attribution data is often disconnected between app and website, or across multiple devices, which blocks visibility into the full user journey and undermines the accuracy of attributions.
- Many marketing teams access paid, owned, and earned data using disparate tools that don’t talk to one another. Multiple networks might take credit for the same install, so totals are never accurate.
- Attribution fraud, which happens when bad actors manipulate tracking data to claim credit for user conversions they didn’t drive, distorts reporting data. A manipulative affiliate can position itself as last touch for a user already planning to install your app by firing a high volume of clicks until one lines up with an install (also known as “click spamming”) or dropping tracking cookies without genuine engagement (also known as “cookie stuffing”).
The combination of these challenges undermines the validity of any marketing data analysis, regardless of which system runs its. You need confidence that your datasets don’t attribute the same install to multiple affiliates, that they provide correct attributions every time, and that they haven’t fallen victim to attribution fraud.
Most teams need a data science function just to reconcile the numbers before starting their analysis, and the challenges only grow once AI enters the picture. AI dramatically accelerates data analysis, but its results are only as valid and useful as the data underneath them.
What to look for in an AI analytics tool
When mobile marketing teams evaluate AI for data analysis, they need to look for a tool that unifies data before analyzing it. Three things matter most:
- Data unification. Combine paid, owned, and earned attributions into a single, deduplicated source of truth, then let AI surface the patterns in that data.
- Data privacy. The tool should run on your first-party data without training models on it.
- Transparency. The tool should show its work, not just hand back a number.
Data unification is a core competency of Branch. Branch is a deep linking and AI-powered measurement platform that enables marketing teams to unify and attribute user journeys across any channel. It deduplicates data across all channels, then connects activity to real business outcomes in a way that marketers can defend. That clean, complete picture of user interactions helps marketing teams identify what’s working, what’s not, and demonstrate their campaigns’ ROI.
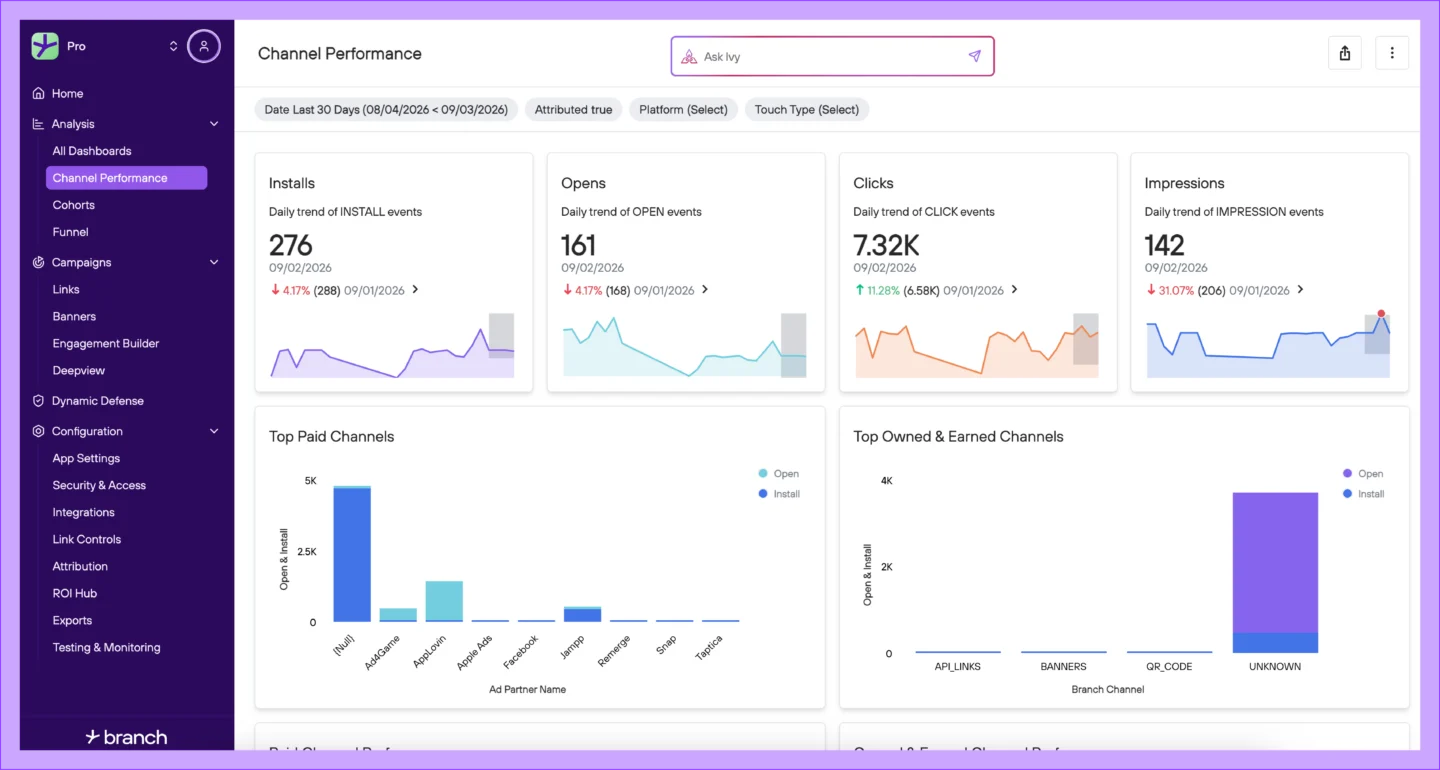
On top of this unified data foundation, Branch layers Ivy, its integrated AI. Ivy responds to questions about campaign performance and user engagement by drilling into the customer’s own first-party Branch data. You can ask things like “What are our top channels by installs this month?”, “Which performed better, our Meta or Google campaigns?”, or “Why did cost per install increase after our last launch?” and get answers pulled straight from your own data, not a black box.
Data analysis with AI does have its limits. As with any use of artificial intelligence, AI marketing analytics require human review. Check suggested measures, dimensions, and filters before data reaches a dashboard for wider consumption, and make sure that the volume of data underlying the AI analysis is large enough for the results to be meaningful.
How does AI help with attribution data?
If you take the right steps to clean your datasets, AI tools can provide incredible attribution insights in response to questions asked in plain language across these four areas:
- Exploratory. Consider a traditional marketing team generating their weekly performance report. A team member has to open three different dashboards, export a CSV file for each channel, and build a pivot table that strips out any installs which overlap across multiple networks. When that’s finished, they have to cross-reference the data by hand to build a spend export that details cost per install across different dimensions. This process requires the team to spend multiple hours every week putting together the report. By contrast, using an AI tool that accesses a high-quality consolidated dataset enables the marketing team to generate the same report by simply entering “Show me the installs, and cost per install, by channel for the past 30 days and compare with the prior 30 days.”
- Diagnostic. AI is also highly efficient at chasing down the cause of changes in the data. Imagine how a marketing team would dig into the causes if their weekly report indicated that cost per install had spiked. An analyst might rebuild the view not only by campaign, but also by platform and geography. They would check this information against launch dates for internal creatives and any shift in App Tracking Transparency (ATT) opt-in rates, likely requiring assistance from a data science partner. After modernizing with AI, however, they could just ask the tool, “Why did cost per install increase over the past two weeks? Break it down by partner and platform.”
- Comparative. AI is also strong at comparing the performance of marketing campaigns across channels. Without AI, marketers pull campaign data into a spreadsheet or data viz tool and look at the stats, side by side. They might align date ranges and metric definitions by hand, hoping both source dashboards define “conversion” in the same way and only partially trust the results if that isn’t clear. By contrast, running AI on a clean, unified dataset lets them ask, “Which Meta campaigns drove the highest purchases in Q3 2025, and how did that compare with Google campaigns?”
- Benchmarking. Spreadsheets make internal analysis hard enough; they make benchmarking nearly impossible. Say a team wants to establish whether its 22% Day 7 (D7) retention figure is good. Before performing any analysis, the marketer has to find an industry report that lists a figure for D7 with roughly the same vertical and time window. Alternatively, they could ask AI, “How does my D7 retention compare with the median for my vertical?” By aggregating anonymized data across customers, AI benchmarks provide a broad perspective without revealing any information from individual customers.
Query quality depends on specificity. “How are my campaigns doing?” is unanswerable. “Show me installs from my SMS campaign among new users in September 2025 compared with August 2025” returns data that’s ready for a performance dashboard.
A high-quality AI query about marketing performance will include:
- When? Timeframe is crucial (e.g.,, “Q3 2025”)
- What? Be clear about the results you’re seeking and exactly what you’re looking to measure (e.g., “installs”)
- Who? Who is the audience? Which users are you interested in (e.g., “new users” only)?
- Where? Which channel should the query focus on (e.g., Meta)?
- Key comparison. Specify which factors you want to compare (e.g.,“QR code vs. email”)
AI also enables anomaly detection. Separate from answering direct questions, AI systems look for exceptions to patterns, flagging anomalies that may point to opportunities, problems, or fraud.
AI-powered analysis you can actually trust
AI sharpens the marketing decisions built on your data, and speeds up how your team gets there. See how Branch’s clean, connected mobile measurement makes AI-powered analysis something you can actually trust. Request a demo today.
FAQs
AI helps with marketing data analysis by letting you query attribution data, surface trends, and flag anomalies in plain language, once your data is clean. It’s the kind of work that used to take an analyst hours in a spreadsheet.
Yes, AI can detect attribution fraud by flagging anomalies in your data, patterns like click spamming or cookie stuffing that deviate from normal user behavior. Branch’s integrated AI, Ivy, analyzes those patterns automatically and blocks fraud before attribution.
A good AI query for marketing data is specific: it names a clear timeframe (When), the metric you’re looking for (What), the audience you care about (Who), the channel you want to focus on (Where), and the comparison you’re making. “How are my campaigns doing?” won’t get you far, but “Show me installs from my SMS campaign among new users in September 2025 compared with August 2025” will.
A BI tool visualizes whatever data you connect to it and leaves reconciliation to you. Branch unifies and deduplicates the data first, so what you’re visualizing is already trustworthy.