What is the most common pre-install user journey for my app? Is there a channel where engagement directly correlates to shorter click-to-conversion paths? Are specific top of funnel marketing activities more influential than others?
A customer’s path to conversion is rarely — if ever — straightforward. Filling in the gaps to understand how users are interacting with your marketing activities prior to their “last touch” just became easier with Branch’s Predictive Modeling algorithm.
Defining Last Touch and Multi-Touch Attribution
Last Touch Attribution logic gives credit for a conversion event to the most recent click or impression.
Multi-Touch Attribution logic gives credit for a conversion event to clicks and impressions leading up to the conversion event.
While last touch attribution provides powerful data for assessing campaign performance and marketing spend efficacy, it doesn’t paint the full picture of a user’s journey to conversion. For example, if a user clicks on three blog links and an email link before clicking on a mobile web banner and converting, a last touch model will award the conversion entirely to mobile web. With multi-touch reporting, you’re able to uncover insights into the contributing marketing activities beyond that final touch, to understand a user’s complete path into the app, no matter how winding.
So why doesn’t everyone use multi-touch to power their marketing decisions?
Although multi-touch is seen as the paragon of attribution reporting, it’s difficult to put into practice. Firstly, it requires resolving user identities across a variety of touchpoints — a task difficult for businesses who don’t have persistent logins for a majority of their users (and then even more difficult when it comes to linking together anonymous traffic). Even when these data points are available, you also need a data model that can ingest this information and make it useful for stakeholders across channels. In other words, getting true value out of multi-touch reporting is both a time-intensive and expensive process.
Enabling Multi-Touch Insights with Branch
Branch has traditionally leveraged last touch attribution to award attribution credit to various marketing channels; however, the predictive modeling algorithm powering our attribution under the hood also enables us to stitch together multi-touch paths to conversion.
We’re exposing these powerful insights for the first time with a predictive modeling algorithm. This yields a single anonymous view that can stitch together events that you previously believed to be anonymous and untraceable (i.e. logged out web visitors, clicks that don’t convert, etc). You can use this view to better understand user interactions across touchpoints, information that can drive marketing strategy, mapping out the customer journey or building complex MTA models.
Anonymized Case Study of Customer Data
We can look to the excerpted report below, based on anonymized data from a customer in the media space, to understand the type of business insights a predictive modeling algorithm can drive.
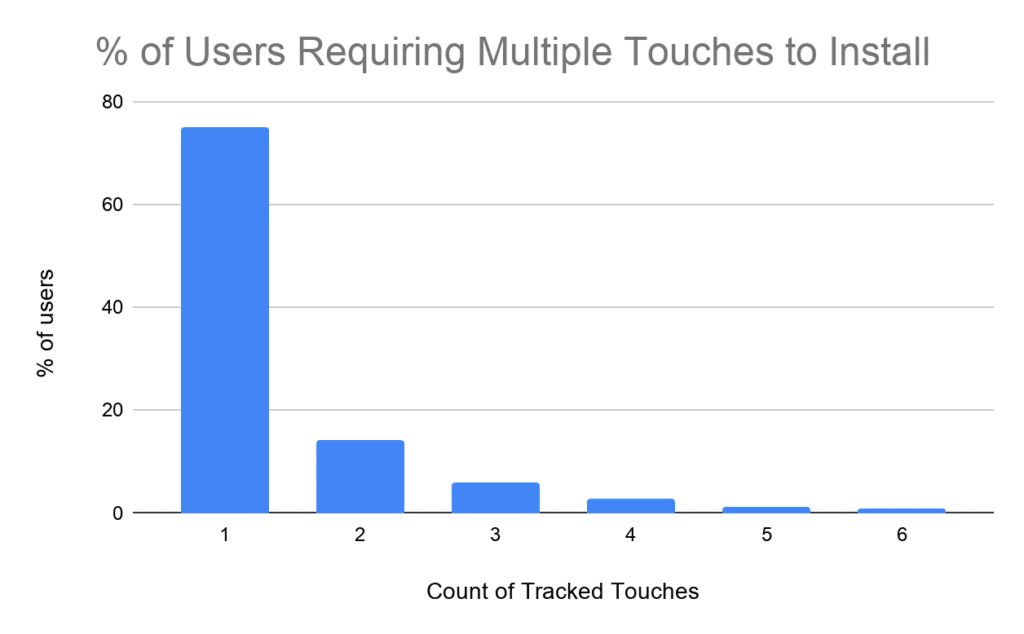
Pre-Install Multi-Touch Journey
This Branch customer saw approximately 25% of users touch Branch links in two or more channels prior to installing within their click-to-install attribution window.
Touch Position Analysis
User acquisition isn’t just driven by acquisition-type touches. Sometimes shallow acquisition on mobile web followed by smart re-engagement is what a user needs to solidify intent to download. Using a predictive modeling algorithm, we’re able to better understand the touchpoints driving both top of funnel discovery and downstream re-engagement.
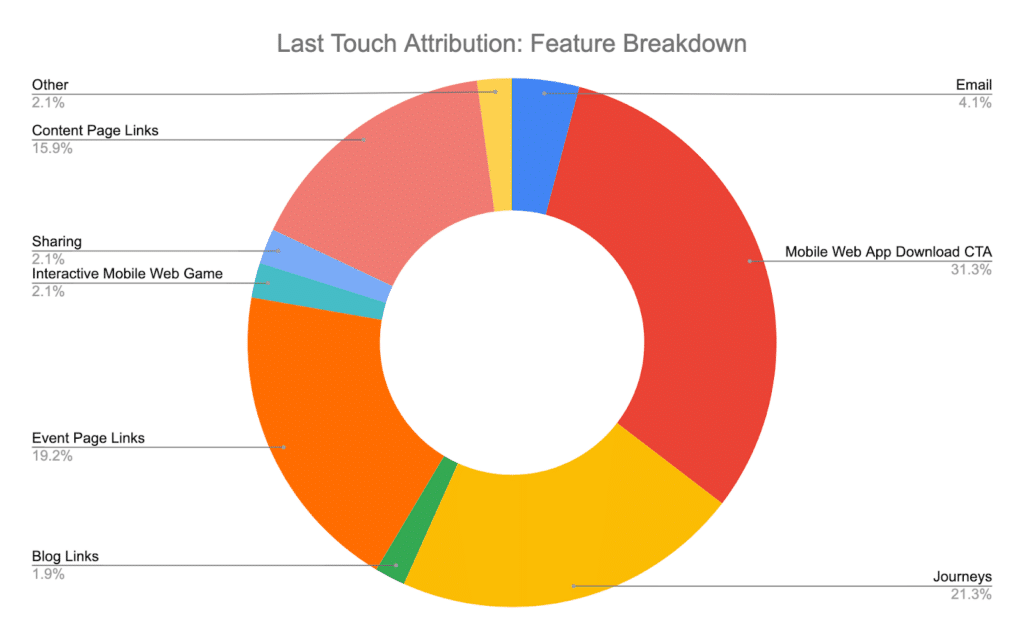
The Last Touch View of the World
The state of the industry is to report on the last touch that drove the app install, so we want to start this case study with that view. This is what you’d see directly on any reporting dashboard used. Note that, of course, Journeys and mobile web app download CTA represent the biggest chunk of the pie here at 53%. This makes sense since the user already has the intent to download and just wants the fastest route there.
What Channels Assisted the Last Touch
Rather than use some complex models for assigning weight, the simplest way to understand the non-last-touch attribution is with the concept of assists. This chart represents the breakdown of ALL non-last-touch touches. So, for example, if the user clicked on an email and viewed the web page, then clicked on an app install banner, the email and web page touches would be included below but not the app install banner.
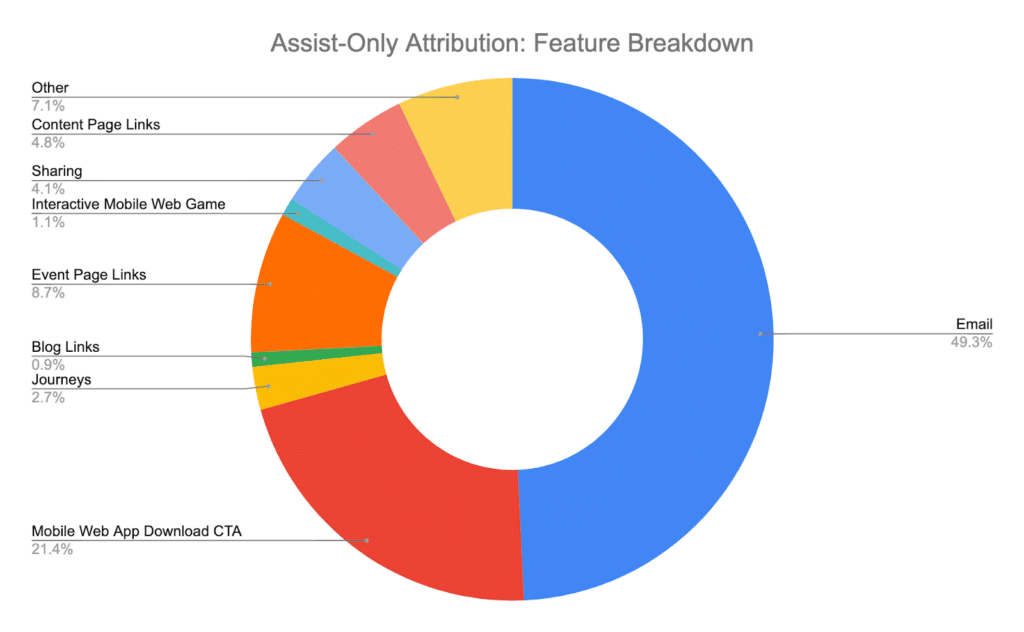
CPID data doesn’t just help you understand the volume breakdown of assist touches. It also gives you a data-driven way to value your marketing activities with the full customer journey in mind. For example, for this customer, it becomes clear when looking at the below chart that email is being undervalued by the business, as over a third of credit is being awarded to other features where an email assist touch drove an install within the customer’s attribution window.
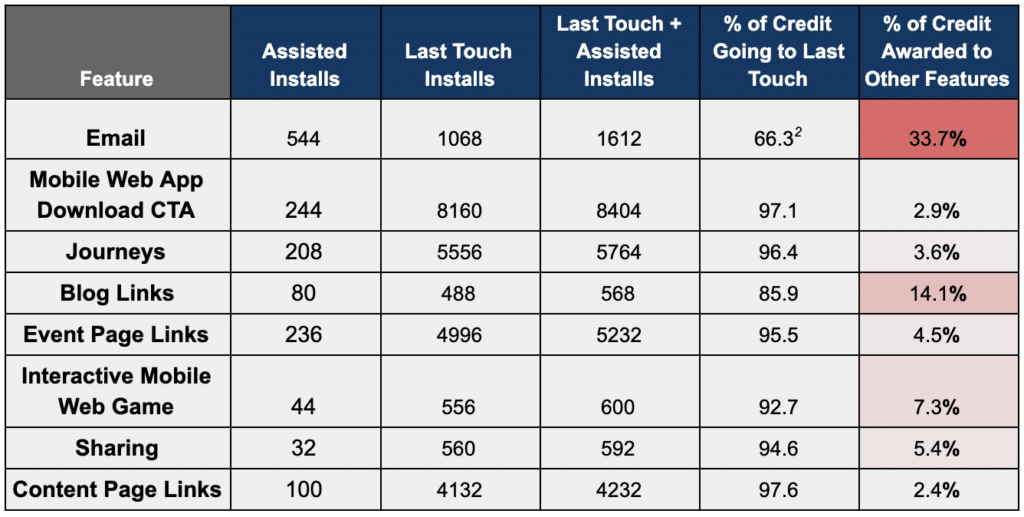
1Data excerpted for top 8 features
2Calculated by dividing Number of last touch installs / Number of last touch and assisted installs
Understanding The Full Multi-Touch Journey1
Using last touch attribution, it’s nearly impossible to gain insight into how a user engaged with your marketing activities prior to conversion. Branch’s predictive modeling algorithm helps fill in this view by giving insight into all the touches leading up to the last touch. This chart reflects a percent breakdown by feature of where users engaged along the path to install. For example, if a user shared content, then clicked on an email link, before ultimately installing via a blog post, the sharing, email, and blog touches would be captured as LT-2, LT-1, and Last Touch respectively.
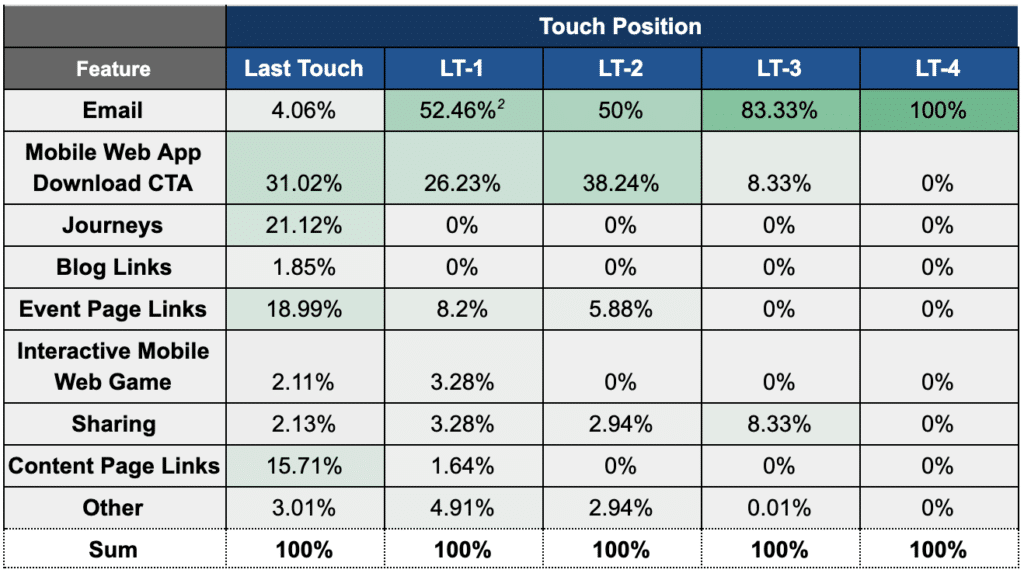
1Data excerpted for top 8 features
2Calculated by dividing Number of LT-1 email touches / Number of LT-1 touches
Install Conversion Effectiveness (%) by Feature1
The below chart measures how effective features were at driving users to install at each touch number. The customer’s Journeys banners and mobile web game were very effective at driving short click-to-conversion paths, with 90%+ of first touches coming from both resulting in install. On the other hand, site links were more effective at driving installs when the user did not download immediately.
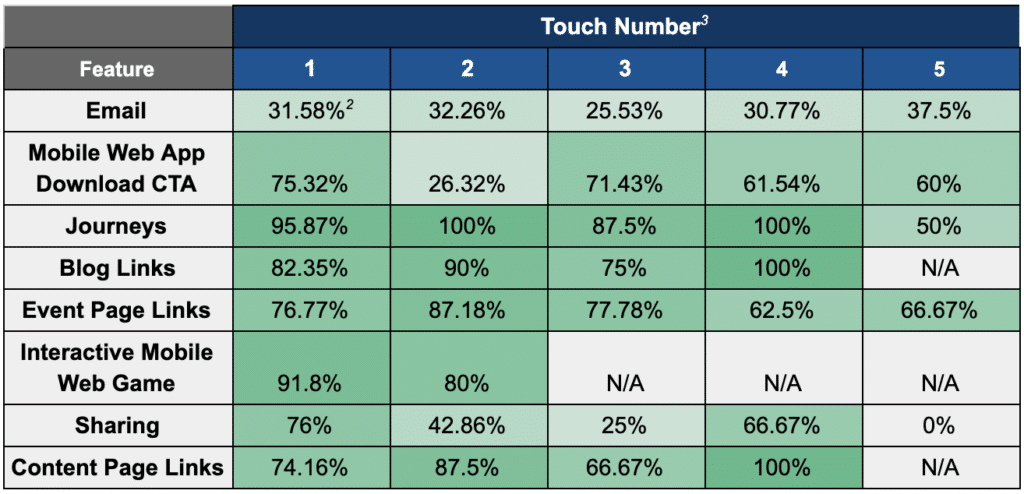
1Data excerpted for top 8 features
2Calculated by dividing Number of email first touches that resulted in install / Total number of attributed email first touches
3Refers to a fixed touch position, as opposed to touch position relative to the last touch
Recommendations Discovered via a predictive modeling algorithm and MTA
Ultimately, our predictive modeling algorithm empowers marketing teams to make data-driven decisions with the complete user journey in mind, without building a multi-touch attribution model from scratch.
For this customer, more than half of first touches came from the site (Journeys or embedded links) and these were quite effective at driving installs. But when the user didn’t convert right away, email (and mobile web visits driven by email) became exponentially more valuable.
Based on these insights, recommendations included:
- Increasing Journeys coverage across the sitemap to improve brand awareness
- Doubling down on email as a critical re-engagement channel
- Scaling interactive games across the mobile web experience
If you’re interested in learning more about a predictive modeling algorithm, contact your Customer Success Manager or Branch Sales for more information!