We’ve unveiled our most recent set of dashboard improvements! Our aim is to make Branch easier to use than ever before, and the latest changes include an improved filtering experience for faster navigation, customizable metrics tailored specifically to your needs, and an improved Column selector across all tables.
With these newly-implemented features in place, uncovering valuable insights has never been easier. Check out the latest experience here, or keep reading for a look at what you can expect.
What’s changed?
1. New and improved filtering experience
First up, we’re bringing together multiple filter controls across tables and charts together into a beautifully redesigned experience.
Now, it takes just a few clicks to get the data you need, starting with the addition of a sticky, consolidated filter bar.
This filter bar also includes a straightforward date range selector. It provides both a pre-configured as well as a custom date range selection.
Bookmarks are now Views! This exciting update gives you the ability to create, pin, and share your favorite Views for future reference.
To enable easier collaboration and sharing, you can even copy a pre-generated link to any given View.
If you’re looking for the new filter bar, you’ll find it in the Branch dashboard on the following Analytics pages:
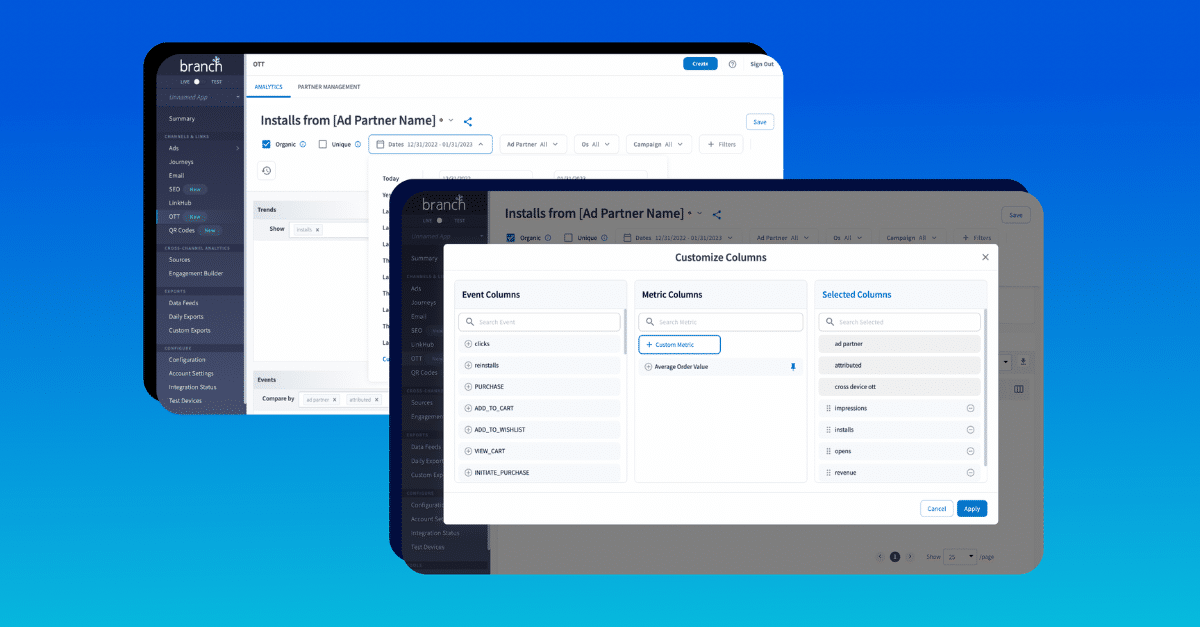
2. Build your own Custom Metrics
You can now make your own Custom Metrics within Analytics tables. This means even more customized insights from your aggregated data.
We also support formulaic calculations between event counts and aggregations. This means you can now build a list of custom metrics that are specific to your business — with custom formulas.
There are also a variety of templated, default calculations to choose from, such as Average Order Value, Customer Acquisition Cost, and more.
In addition to pre-configured default events, this module also gives you the ability to create custom metrics specific to a particular app for all users.
3. Drag-and-drop events via a custom column selector
Originally available to a select few tables, our custom column selector bar is now available on all tables within the Branch dashboard.

With the latest version of the custom column selector bar, you can now pick and choose which Events and Metrics belong in your columnar table view.
You’ll also find that events are now sorted based on frequency.
By drag-and-dropping the columns via the selector bar, you’ll see an updated table with the columns of your results table.
Branch makes your life easier and more efficient
Our latest set of dashboard improvements will give you flexible access to powerful data while also saving you time! Keep an eye out for even more improvements in the near future.
Request a demo to get a firsthand look at how these new features can enhance your workflow.